In This Set of Visual Number Talk Prompts…
Students will extend a growing linear visual pattern, make near and far predictions and describe the pattern in words.
Intentionality…
The purpose of the Visual Math Talk Prompts in Day 4 of the Bird Migration Linear Relationships unit is to reinforce key concepts from Day 3. Students will engage in a math talk using graphical representations of patterns. These visual number talk prompts serve to develop a deeper understanding of the following big ideas.
- Patterns can be extended because they are repetitive by nature.
- Pattern rules are generalizations about a pattern, and they can be described in words.
- One common use of linear patterns is predicting future events.
- A pattern can be extended to make a prediction.
- For far predictions, calculations are required for efficiency.
- In a growing pattern, the values increase.
- In a linear pattern, the values increase at the same rate.
- The rate can be determined by finding the difference between the value of two terms.
- Graphical representations of linear growing patterns appear as straight lines.
- The initial value in a linear pattern is the constant.
- When the initial value is not zero, the relationship between the two variables is not proportional.
Visual Number Talk Prompt
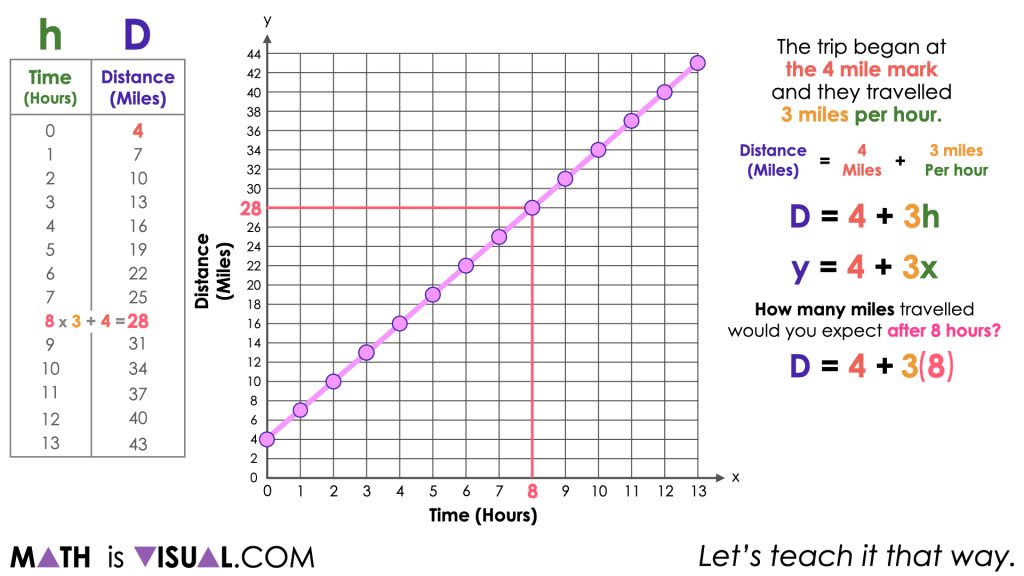
Present the following graphical representation using the visual number talk prompt video below. For the pattern shared, ask students to describe the pattern rule in words and ask them to predict the value of the 8th term and the 13th term. Students are encouraged to justify their thinking and facilitators are encouraged to look for opportunities to build efficiency. For example, once students have determined the rate, and the initial value, rather than counting on or repeated addition, can students leverage this information to perform a calculation?
Student prompt:
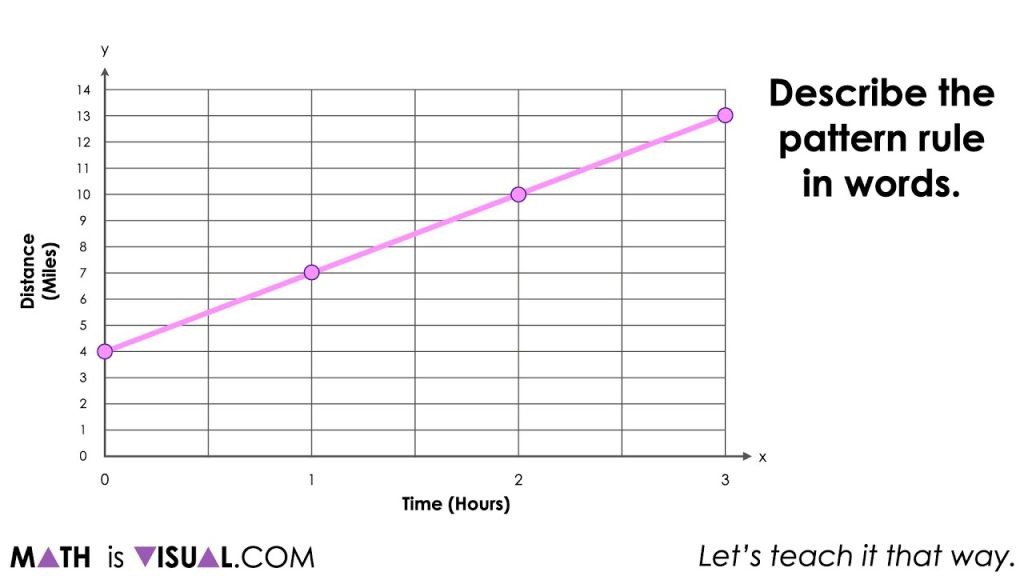
Describe the pattern rule in words.
Be sure to pause the video to give students an opportunity to independently think before turning and talking with a neighbour.
For your reference, the points are (0, 4), (1, 7), (2, 10), (3, 13) which is a linear relationship.
Here are some possibilities for what some students might share with their neighbours and/or out to the whole group:
- The graph is a line.
- It is rising up to the right.
- This graph doesn’t start at 0.
- It is a linear relationship.
- I think we call this an increasing pattern.
- And many other possibilities.
- I wonder if this is another flock of birds migrating?
- The distance is increasing as time goes on.
If students do not elaborate further than this, you might consider prompting students with questions like:
Some of you mentioned that the graph is going “up”. Can you be more descriptive?
Why might the graph start at 4 miles?
How much is it going up by?
Can you be more precise?
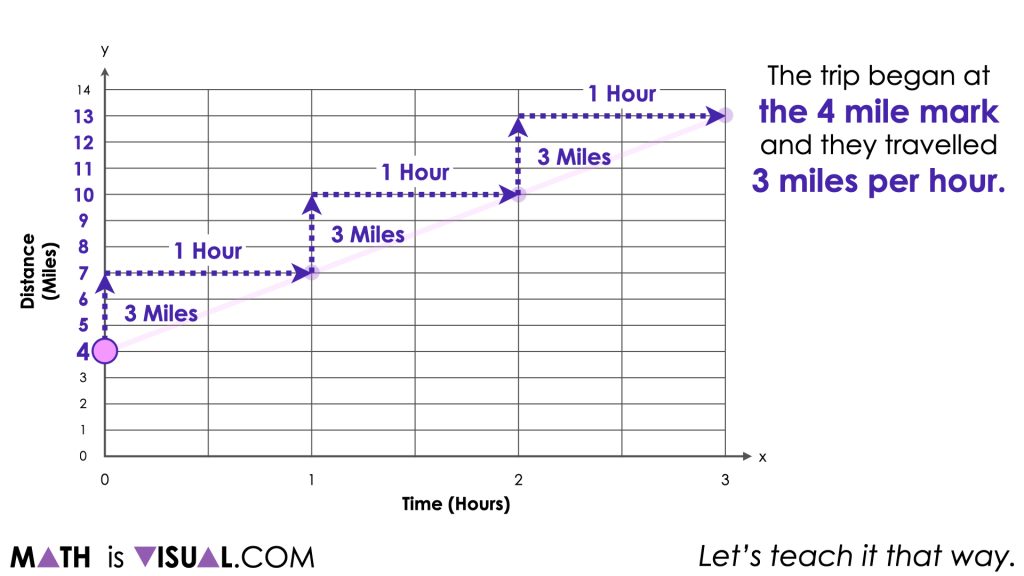
Questions like the above may be able to tease some students to recognize that the distance is increasing by 3 miles for every hour they travel.
Other students might recognize that after 3 miles, they are 13 miles away from wherever they began measuring from.
If you haven’t already, you might want to explain to students that this is another flock of birds and the ornithologist began tracking them when they were 4 miles away from their nesting grounds.
While it may or may not be appropriate to formalize the strategies students are leveraging to help them reveal the rate of change (or slope of the line), it is helpful to note that the strategy students are using here is partitive division of how much the distance increases divided by how much time has passed. When doing this from a graph, many refer to this as determining the rate of change (or slope) as rise over run.
At this point, we can ask students:
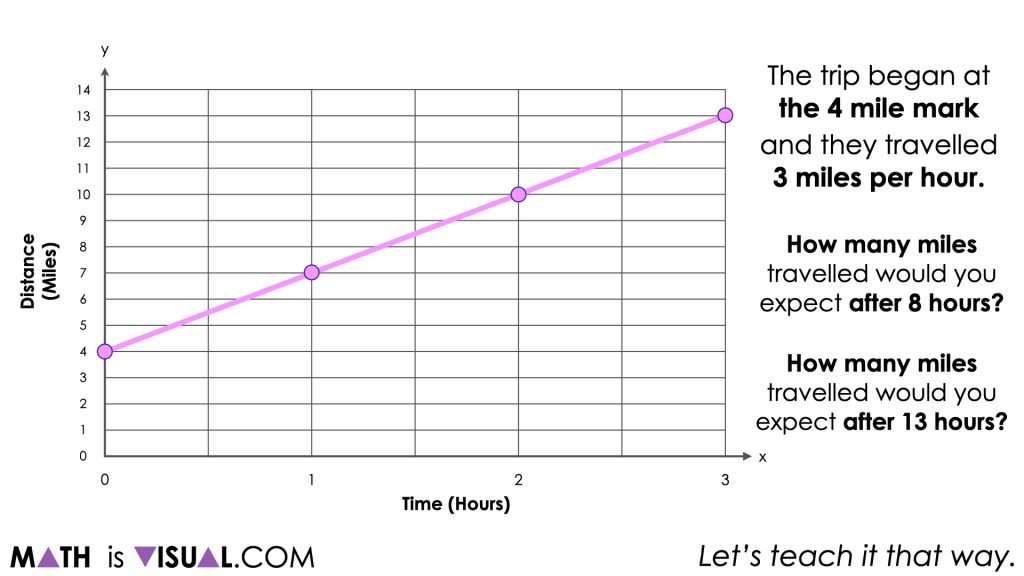
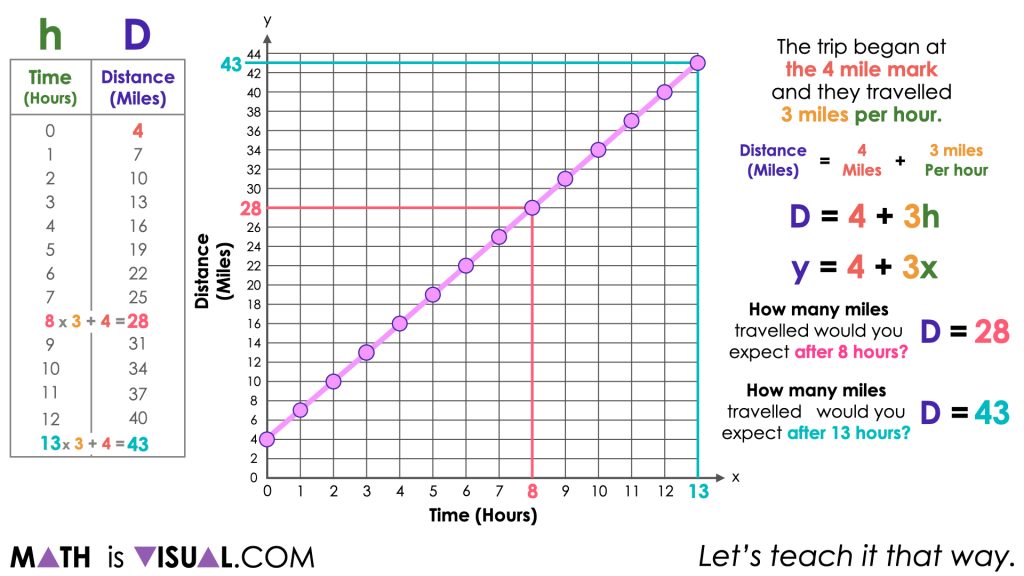
How many miles travelled would you expect after 8 hours?
…. After 13 hours?
Again, being sure to pause so students can think and discuss with a neighbour. Be sure to explain to students that we want their solution to be convincing to others.
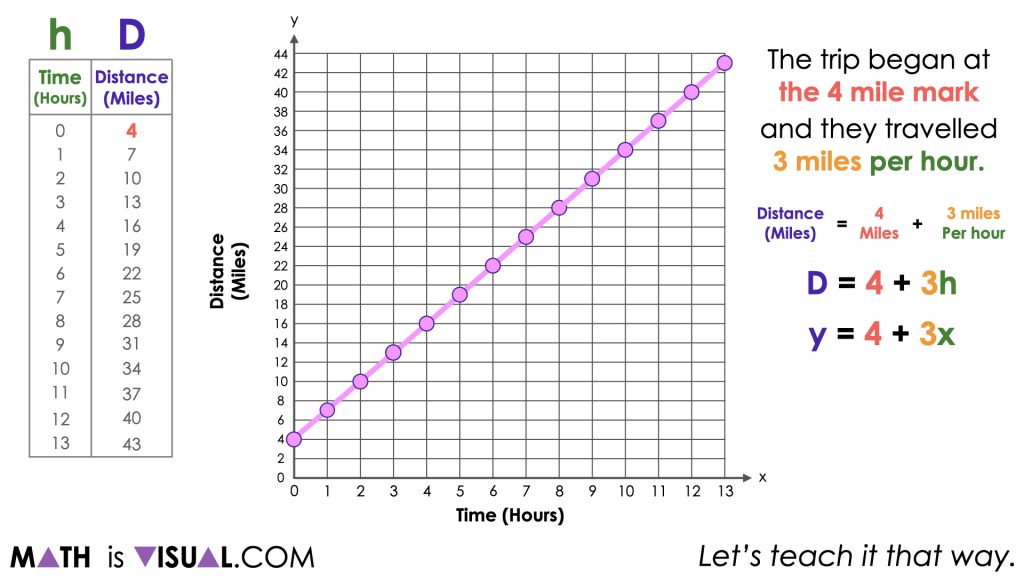
Students may begin building a table of values beginning with the first point, (0, 4) known as the initial value and continue recording each point along the linear relationship. Some students may notice that with each passing hour, the distance increases by 3 miles.
While they may not realize it at the time, this increasing pattern of 3 miles for every 1 hour (or ratio) can be leveraged as the rate 3 miles per hour to make determining other values more efficient.
Some students may even recognize that since the graph began at the 4 mile mark and they travelled 3 miles per hour, that we can construct an equation that might look something like this:
Number of Miles = 4 miles + 3 miles per hour
N = 4 + 3h
y = 4 + 3x
By leveraging the equation, we can now substitute 8 hours for the independent variable and simplify to reveal the total distance travelled after 8 hours.
By leveraging the equation, we can do the same for the total distance travelled after 13 hours to confirm the total distance travelled was 43 miles.
While different students may have found the total distance after 8 and 13 hours using different strategies and models, the goal here is to help students extend their thinking to be flexible with multiple representations of linear relationships while ensuring that all students are still able to access the mathematics.
Want to Explore These Concepts & Skills Further?
Three (3) additional number talk prompts are available in Day 4 of the Bird Migration problem based math unit that you can dive into now.
Why not start from the beginning of this contextual 8-day unit of real world lessons from the Make Math Moments Problem Based Units page.
Did you use this in your classroom or at home? How’d it go? Post in the comments!
Math IS Visual. Let’s teach it that way.

![Planting Flowers [Day 2] - Revealing a Rate Through Partitive Division MIV Featured GIF](https://mathisvisual.com/wp-content/uploads/2021/07/Planting-Flowers-Day-2-MIV-Featured-GIF-232x130.gif)
Add comment