Visual Number Talk Prompts using context to build fluency and flexibility with fractions and percent to unpack big ideas around relative frequency.
Category - Data Management & Statistics
Data Management & Statistics, Number Sense
Visualizing Measures of Central Tendency On The Number Line
Visual number talk prompts involving plotting data points on a number line and then finding measures of central tendency: mean, median, mode.
![Olympics [Day 2] - Purposeful Practice - MATH TALK Visual Prompt Animation](https://mathisvisual.com/wp-content/uploads/2022/01/Olympics-Day-2-Purposeful-Practice-MATH-TALK-Visual-Prompt-Animation-3-366x205.gif)
Visual math talk prompts used to help emerge the visualization and understanding of measures of central tendency: mean, median and mode.
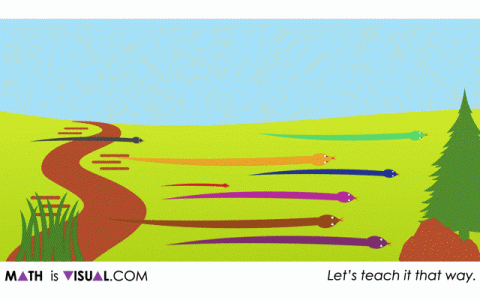
Let's tackle the Theoretical Probability conceptually using a series of visual prompts to promote spatial reasoning and deep understanding.
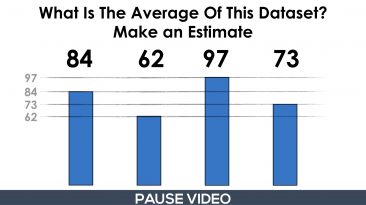
Let's tackle the average of a dataset with larger values conceptually using a series of visual prompts to promote spatial reasoning and deep...
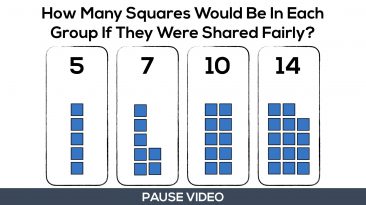
Were you told that you find the mean (average) of a dataset by adding the values and dividing by the number of values? Let's explore visually!