In this Math Is Visual Prompt, students are given the opportunity to wrestle with the idea of the mean or average of a dataset visually.
I was taught that you find the mean or average of a dataset by adding up all of the values and dividing by the number of values. While that procedure will always work, I never understood the conceptual underpinnings of what I was actually doing.
Let’s visualize the mean of a dataset by using square tiles to “redistribute” the extra tiles in the larger groups to the groups with less tiles. We then find the mean or average.
Here we go!
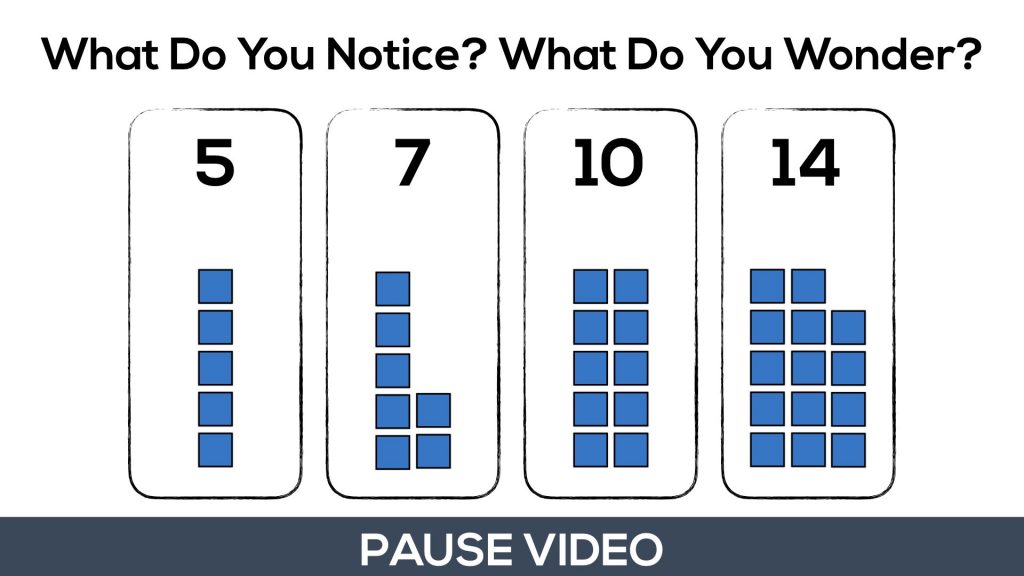
Spark Curiosity: What Do You Notice? What Do You Wonder?
As I do in most every 3 act math task, I use the Annie Fetter “What do you notice? What do you wonder?” to spark curiosity while watching the first portion of this video.
Here’s an image of what students/children will be looking at when you are instructed to pause the video:
After students share what they notice and wonder, you can then show them the next portion of the video until you’re instructed to pause.
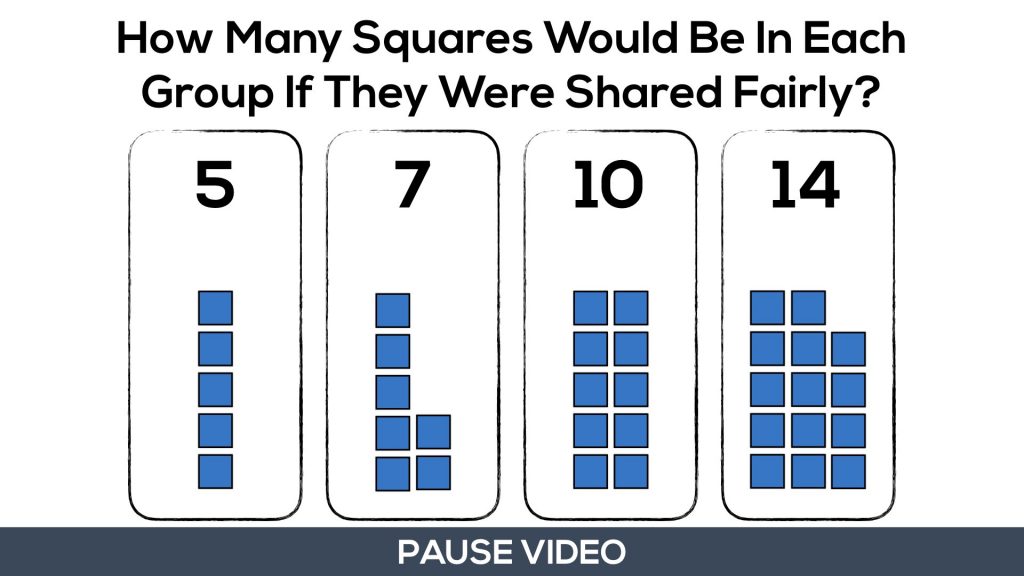
Here, students are asked to determine how many squares should each group have if they were shared fairly?
While students will not know what this idea is called yet, what they are being asked to find is the average or the mean of the dataset.
They will redistribute the tiles to find that each group will end up with 9 squares.
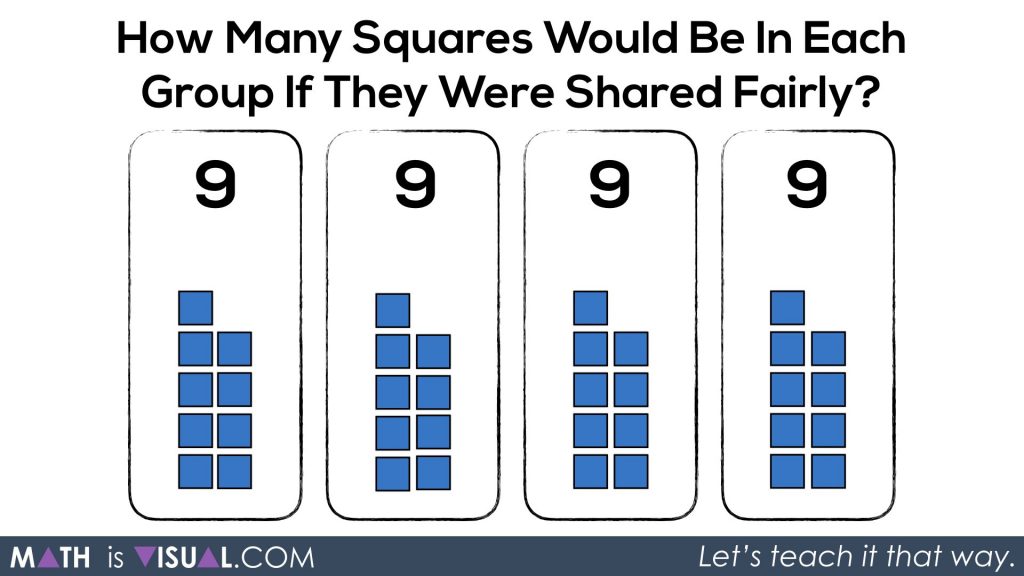
Therefore, the mean or average of the dataset is 9 square tiles.
How’d It Go?
Thanks for watching and reading!
Did you use this in your classroom or at home? How’d it go? Post in the comments!
Math IS Visual. Let’s teach it that way.
Dive into conceptual 3 act math tasks that engage students and also develop procedural fluency throughout.
![Olympics [Day 2] - Purposeful Practice - MATH TALK Visual Prompt Animation](https://mathisvisual.com/wp-content/uploads/2022/01/Olympics-Day-2-Purposeful-Practice-MATH-TALK-Visual-Prompt-Animation-3-232x130.gif)
[…] mentioned in the previous post on the average or mean of a dataset, I was taught that you find the mean or average of a dataset by adding up all of the values and […]
The videos are too slow paced .
Also your videos NEED dialogue.
You have a great idea but not so great execution.
Hi Jim!
Totally appreciate the feedback! The intent of the videos are to give teachers / parents visuals to help support math conversations… be it a math talk at the beginning of a lesson or a math conversation at home.
The goal isn’t for me to “teach” the content, but to provide the opportunity for learning to happen.
While I can see your perspective, I’m not certain that speeding up the pace and me talking overtop is going to help me achieve those goals I’ve just mentioned.
Thanks for stopping by!
is there a way to visualize mean without visualizing squares but by looking at numbers.? Good work
Hmm… numbers are abstract, so I wonder what one would be visualizing if it were numbers?
I really liked this. It was hard to find a video explaining the concept of average for my kids. Most just say “add up the terms and divide by the number of terms”.
I expanded on the video by using a pinata explanation: my kids love having a pinata at a birthday party. When it gets smashed open they all grab as much candy as they can. But then, they like it to be fair, so they have to redistribute the candy so that each child has the same number (of each type of candy). The redistribution is finding the average.
Thanks for stopping by and sharing your thinking. The pinata context is a great one. So relatable for students and easy to make the connection. Thanks for adding another approach to our toolkits!
I noticed that the higher it gets the more numbers fit between the numbers that get higher
The youtube video doesn’t have audio.
Of course not – these are all #SilentSolutions! 🙂