In This Set of Visual Number Talk Prompts…
Students will build their fluency and flexibility with the magnitude of number by plotting values on a number line, then extend this learning to measures of central tendency by determining the range, mean, median and mode.
Intentionality…
This visual math talk prompt serves to develop a deeper understanding of the following big ideas:
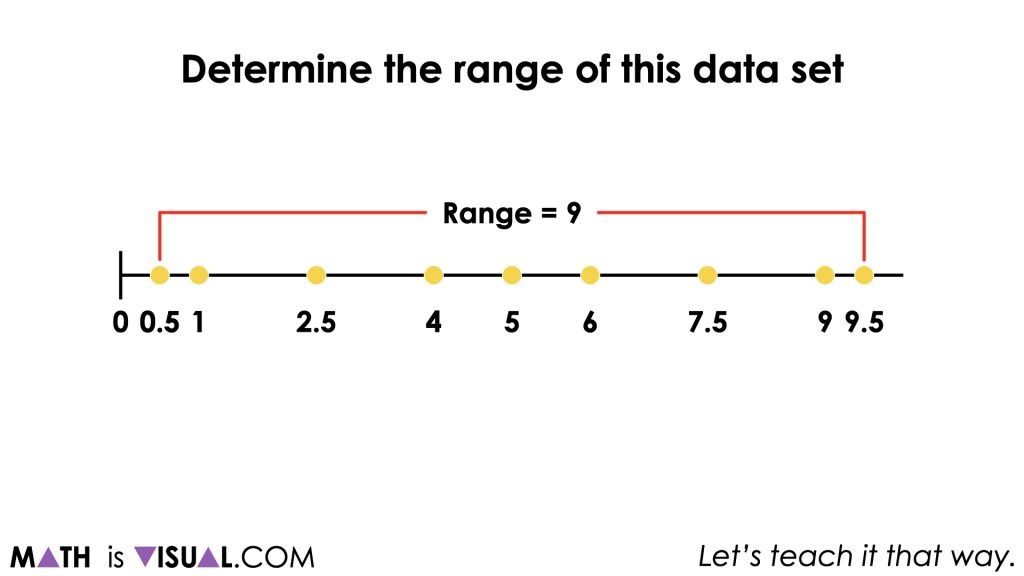
- The range of a set of data is the difference between the highest and lowest values in the set;
- A measure of central tendency for a data set summarizes all of its values with a single number;
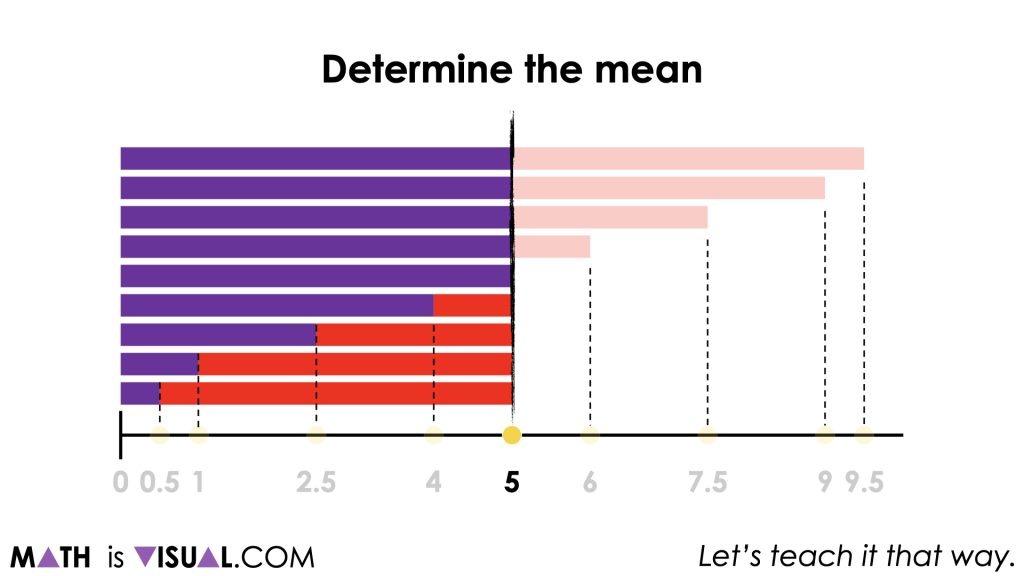
- Mean can be revealed through partitive division; and,
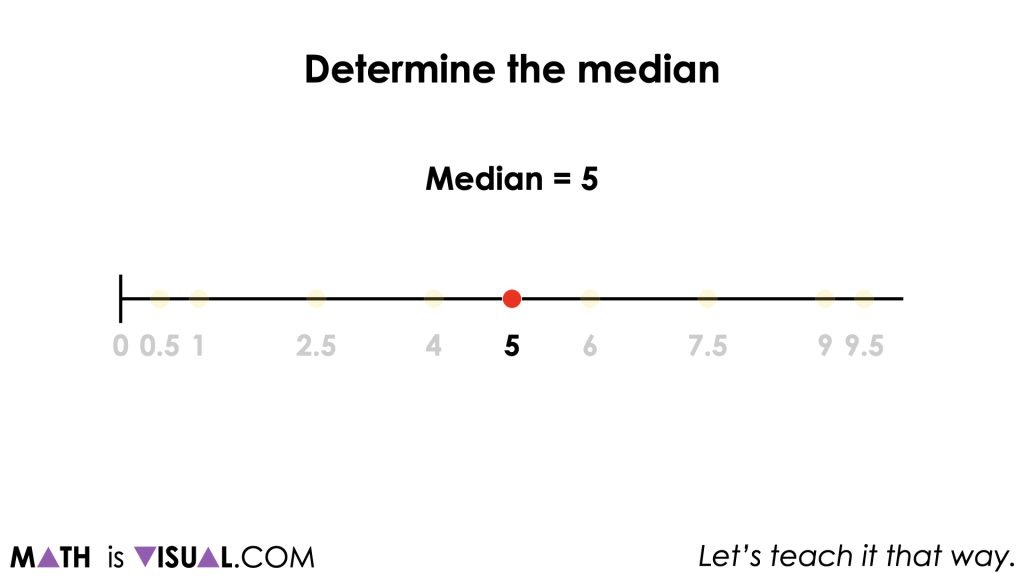
- Median can be easily determined spatially when data points are plotted on a number line.
Preparing to Facilitate This Number Talk
This number talk can be facilitated using a chalk/whiteboard or using the visual number talk prompts provided below.
If facilitating this number talk with a chalk/whiteboard, encourage students to talk to their neighbours and compare before they describe where you should plot your data point up on the board. This not only helps students solidify their own understanding of magnitude of number and spatial relationships, but also allows them to build their adaptive reasoning skills as they explain their thinking out loud.
The data points to be plotted on the number line are:
5
2.5
1
0.5
4
6
7.5
9
9.5
Visual Number Talk Prompt
If facilitating with the visual number talk prompt video, you will want to ensure that you pause for each data point and encourage students to tell you where to place your finger on the line prior to revealing where the data point goes by continuing the video.
The first prompt will ask students to:
Draw a number line from 0 to 10.
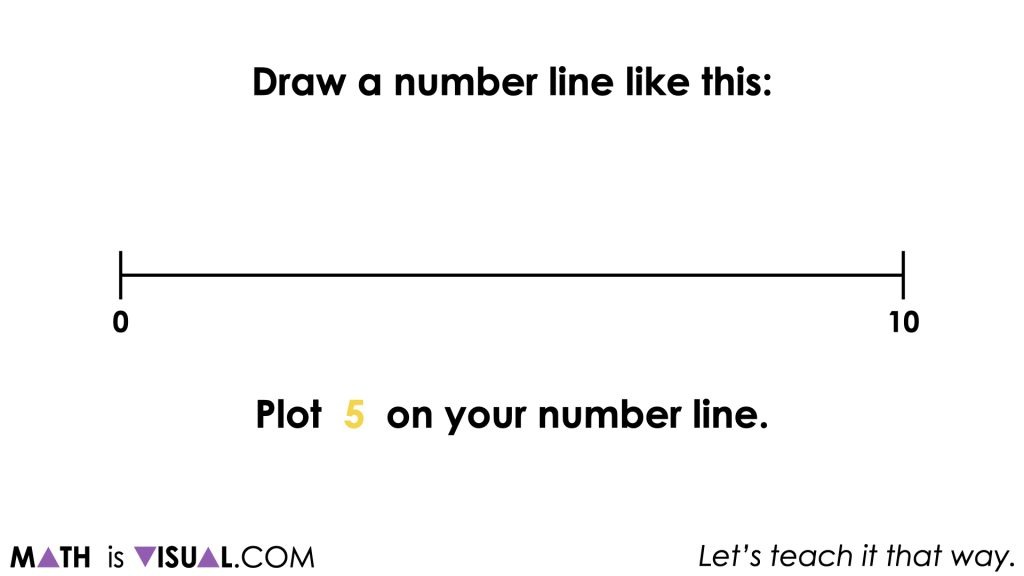
Then, students are asked to:
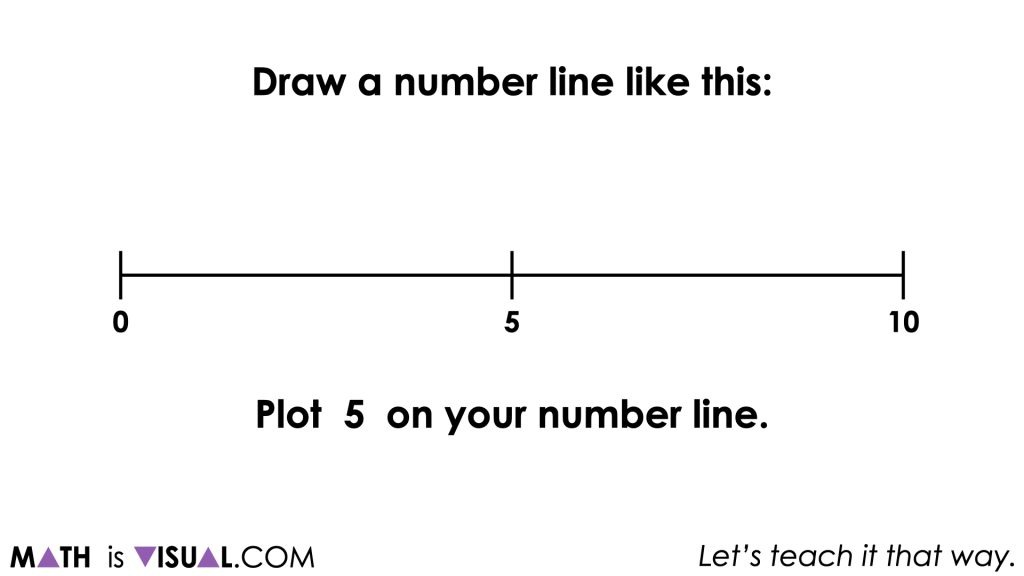
Plot 5 on your number line.
The goal of this portion of the visual number talk is to leverage and build on student spatial reasoning skills and also a better sense of the magnitude of number (i.e.: how numbers relate to one another).
Students will be asked to partition the number line in various ways including partitioning into halves, fourths, fifths and more.
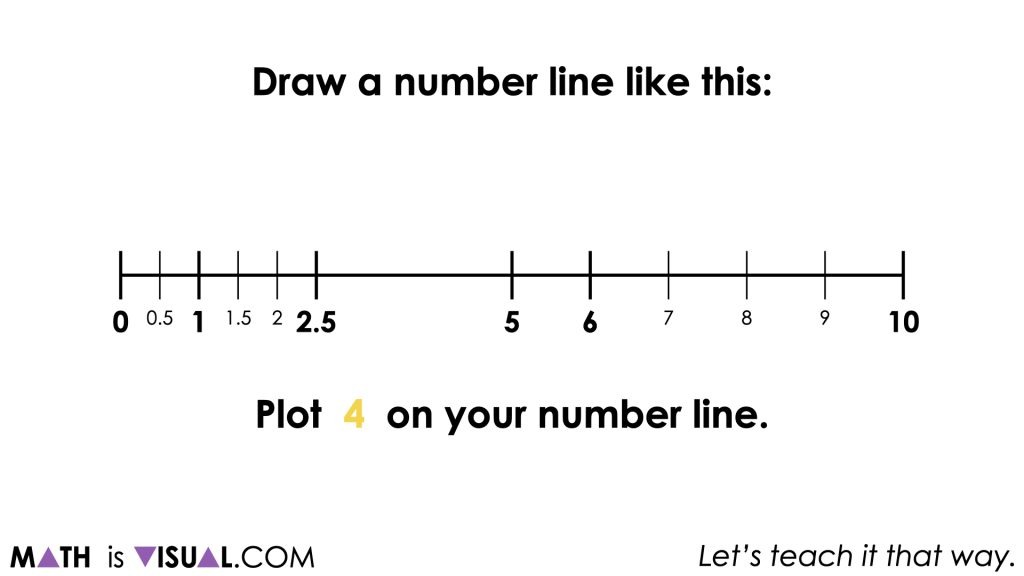
Throughout this exercise, students will also be tasked with plotting decimal numbers as well which increases the complexity of the task.
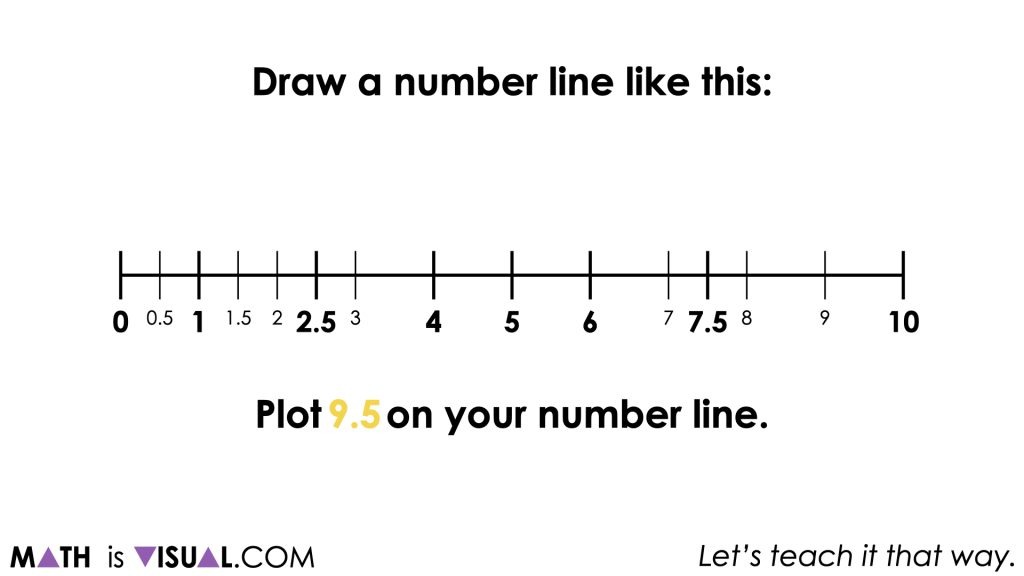
Finally, once all values have been plotted on the number line, students will be asked to find the range, mean, median and mode of the dataset.
Since the values have been placed on the number line, it becomes easier to visualize these different measures that help to describe the characteristics of the data set.
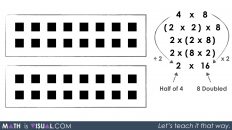
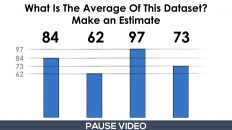
For the mean of the dataset, rather than simply following the procedure of:
“Summing the values and dividing by the number of values”
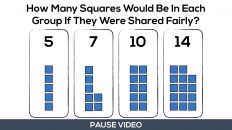
We can help students conceptualize the mean of the dataset as “the great equalizer.“ In other words, we are highlighting that the mean redistributes values so that all “groups” receive the same amount.
For the median of the dataset, students can work their way from the outside data points towards the centre to find the median of the data set or the data value in the middle.
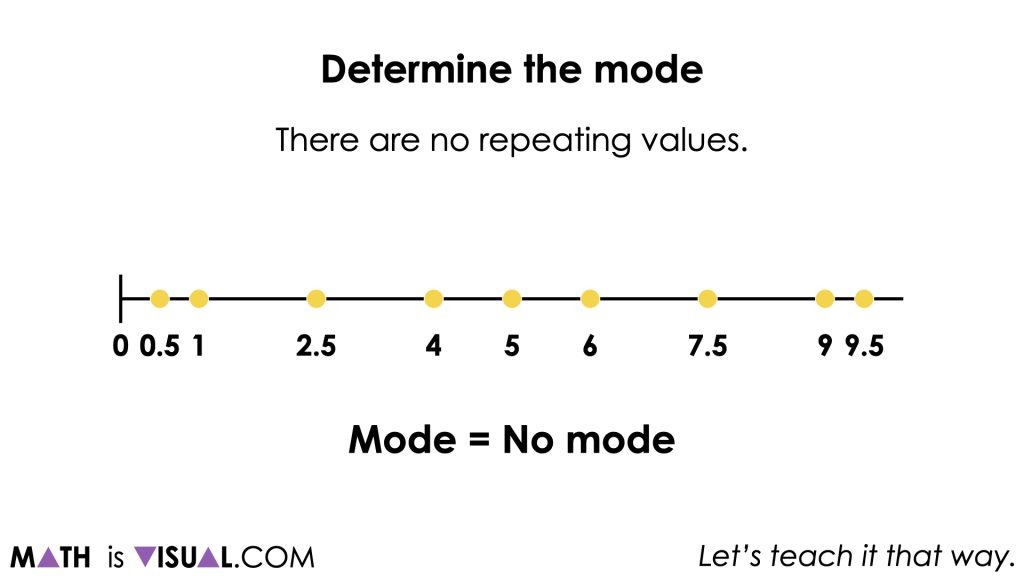
This dataset is not ideal for diving deeply into the mode of the dataset, but it is worthwhile to mention to students that since we have no data value occurring more than the other data values, the mode is not helpful here.
Want to Explore These Concepts & Skills Further?
This visual math talk prompt was shared in Day 4 of the Olympics Revisited problem based math unit that you can dive into with your students now!
Why not start from the beginning of this contextual 5-day unit of real world lessons from the Make Math Moments Problem Based Units page.
Did you use this in your classroom or at home? How’d it go? Post in the comments!
Math IS Visual. Let’s teach it that way.
Add comment