In this Math Is Visual Prompt, students are given the opportunity to wrestle with the idea of the mean or average of a dataset conceptually when the values are larger through visualization and composing/decomposing numbers.
As mentioned in the previous post on the average or mean of a dataset, I was taught that you find the mean or average of a dataset by adding up all of the values and dividing by the number of values. While that procedure will always work, I never understood the conceptual underpinnings of what I was actually doing.
This is the second part of my Visualizing the Average of a Dataset series, so let’s visualize by using an open area-like model to compose and decompose numbers and “redistribute” the extra tiles in the larger groups to the groups with less tiles.
If you haven’t checked out the first post, you should do so prior to exploring this set of visual prompts.
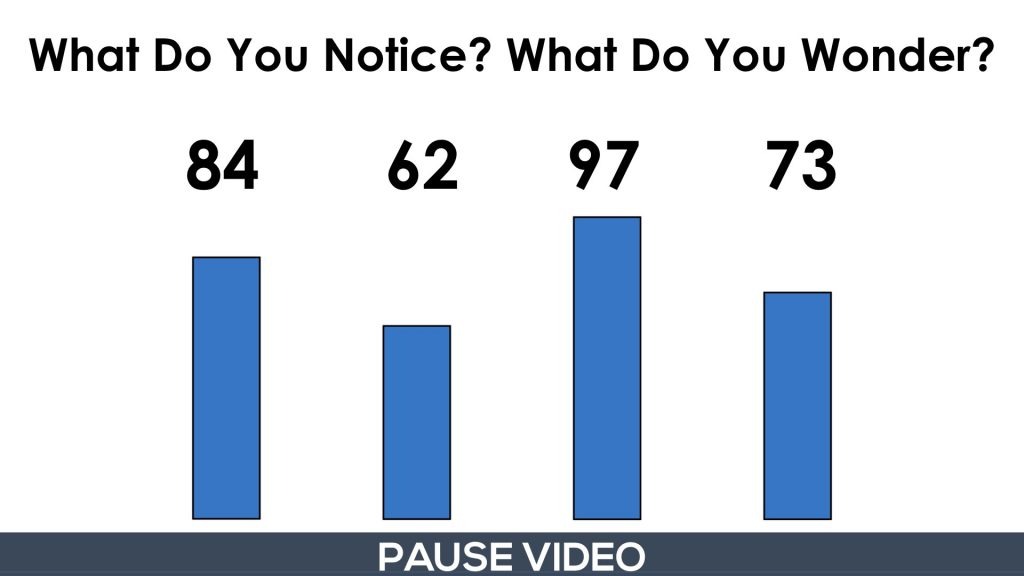
Spark Curiosity: What Do You Notice? What Do You Wonder?
As I do in most every 3 act math task, I use the Annie Fetter “What do you notice? What do you wonder?” to spark curiosity while watching the first portion of this video.
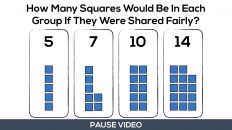
Here’s an image of what students/children will be looking at when you are instructed to pause the video:
After students share what they notice and wonder, you can then show them the next portion of the video until you’re instructed to pause.
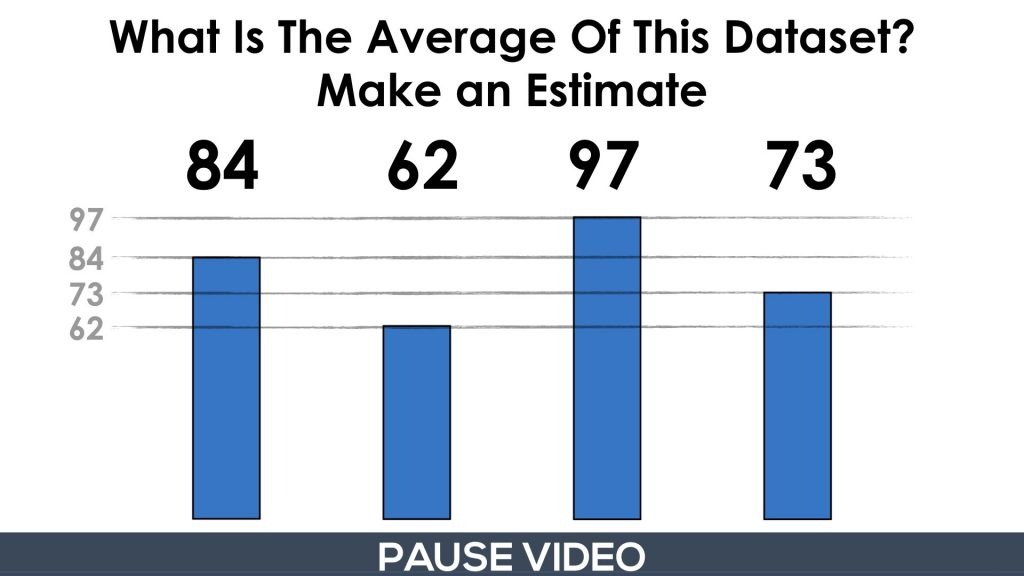
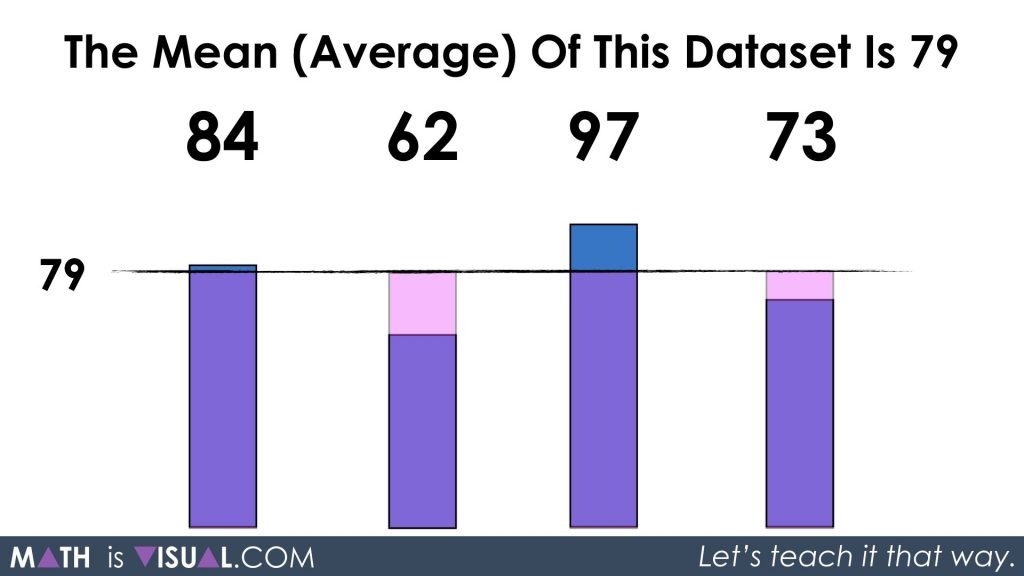
Here, students are asked to determine the average of this dataset. Again, if they haven’t explored the first part of this series, I recommend doing so before exploring this set of visual prompts.
The goal here is to get the students to use their spatial reasoning and number sense to try and find the “middle” of the tops of all the bars. Some students might visualize chopping the “tops” off the higher bars and redistributing to the lower bars.
In any case, the intention here is to make the task accessible for all students as well as to push students to build a conceptual understanding of the mean of a dataset before moving on to developing the procedure for this process of finding the mean by adding the values and dividing by the number of values.
Fuel Sense Making: Visualizing the Average of the Dataset
When you move on, you will start to show one of many conceptual approaches to finding the mean.
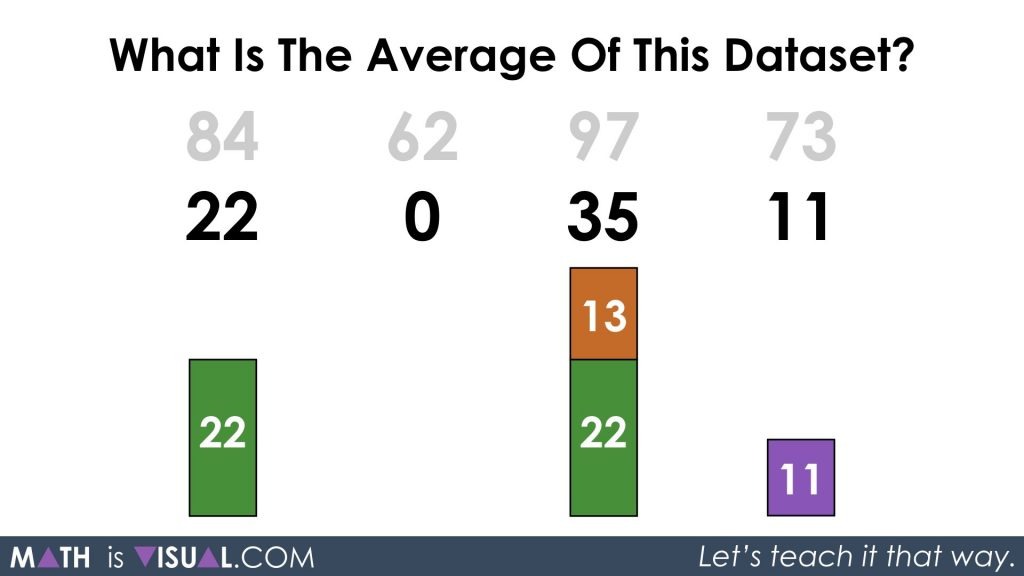
Here, I’ve decomposed the values to show that the lowest value of 62 is “inside” each of the larger values. This references students prior knowledge of hierarchical inclusion from the Principles of Counting and Quantity that are also featured on Math Is Visual and on my other site, Tap Into Teen Minds.
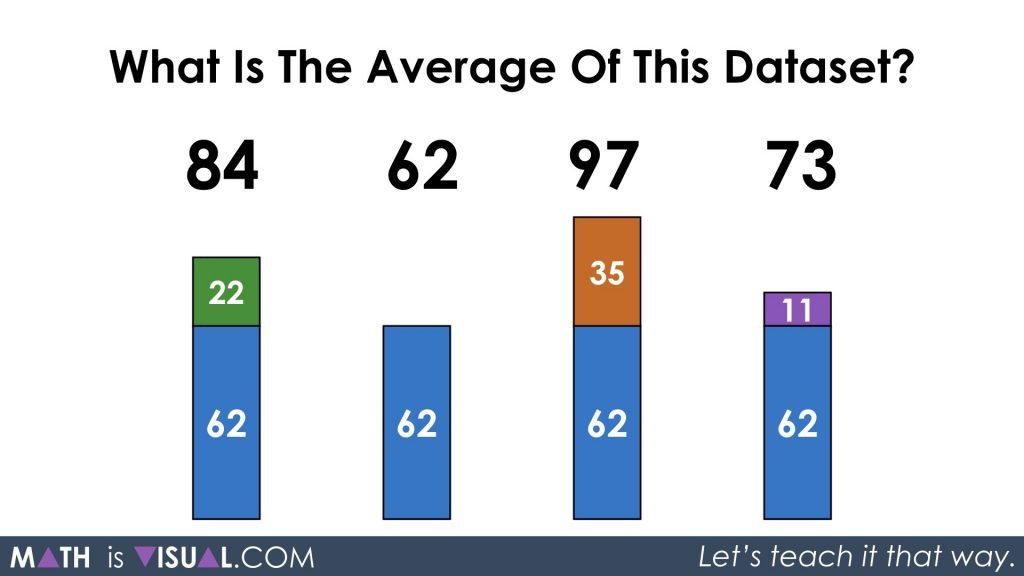
Once we’ve decomposed the larger values into two parts of their original whole, we can temporarily “ignore” the value of 62 and work with what is leftover. It’s like we’re now finding the average of a set of 4 much smaller values, which might be helpful for students who are still working in the concrete stage of concreteness fading and you’re hoping to help press their thinking to the visual stage.
So, let’s get rid of 62 from each value and our “new” dataset is 22, 0, 35, and 11:
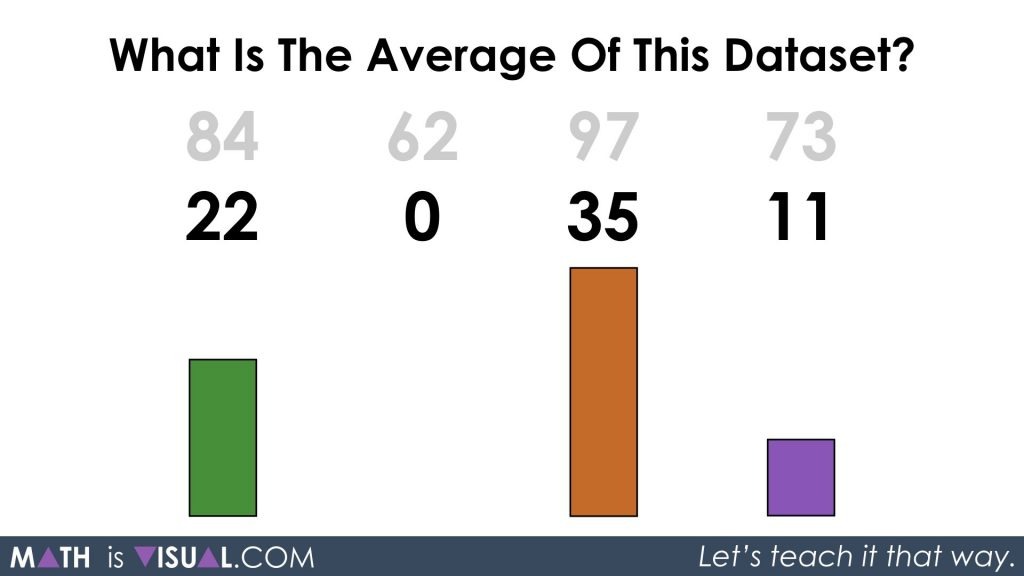
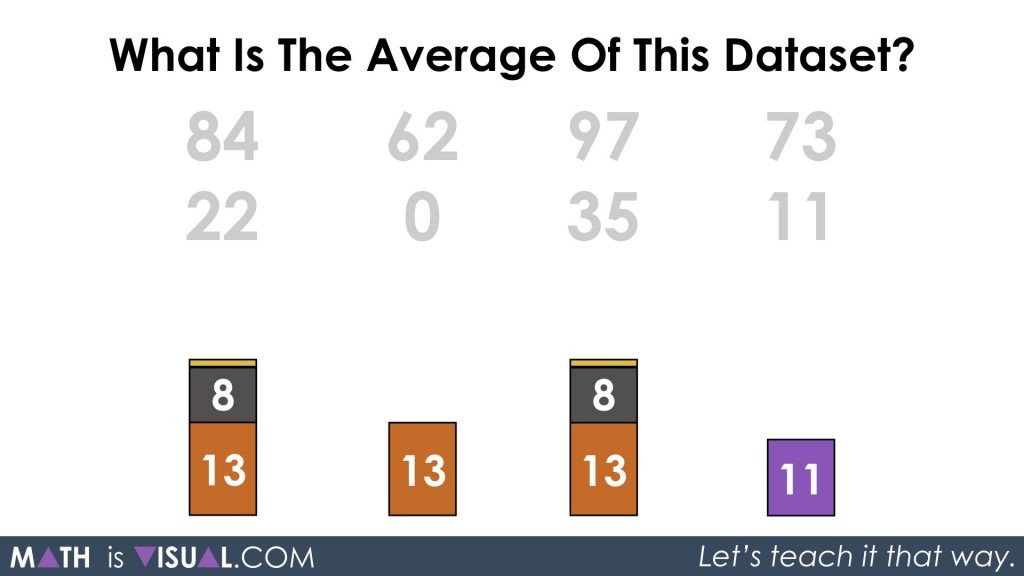
Let’s decompose numbers again noting that our “average” or “mean” value is likely somewhere around the middle two values. What students decide to decompose numbers to will likely vary and all strategies should be celebrated based on their individual progression on the developmental continuum.
Here’s how I did it in this visual prompt, although it should be noted that this is not the “optimal” or “most efficient” strategy. I was going for accessibility to serve as a good visual model:
After decomposing 35 into two parts of 22 and 13, I decided to redistribute the part with the value of 13 to the data value of 0.
I then decomposed the two data values of 22 into 3 parts each of 13, 8, and 1.
After redistributing the two parts of 1 to the last data value in the set, I decomposed yet again chopping the value of 4 into two parts of 2:
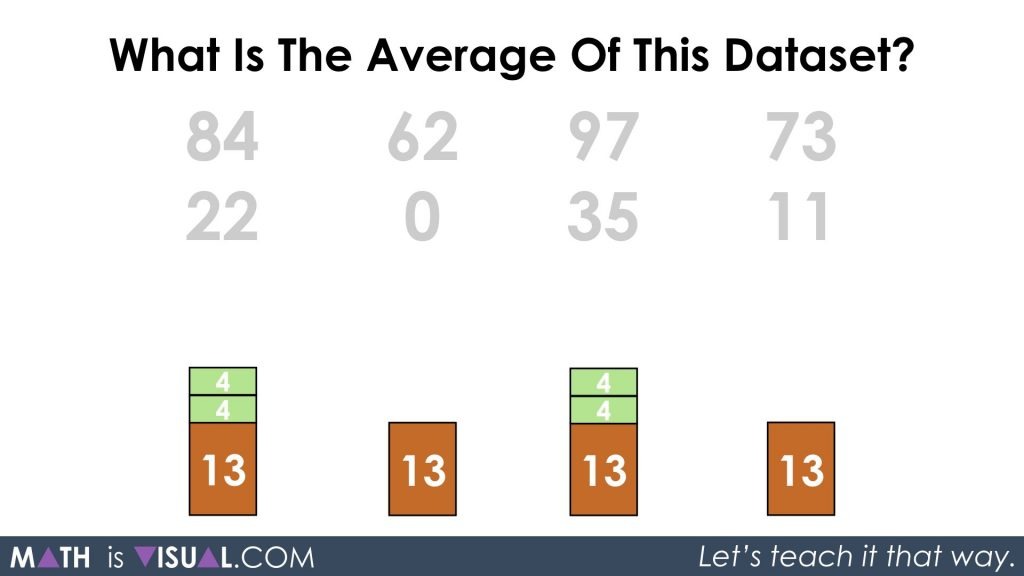
Redistribute and we are left with each having two parts of 13 and 4 which can be re-composed to give us an “average” of 17 for the data values 22, 0, 35, and 11.
When we re-introduce the 62 that we had temporarily shoved to the side, we are left with two parts of 62 and 17:
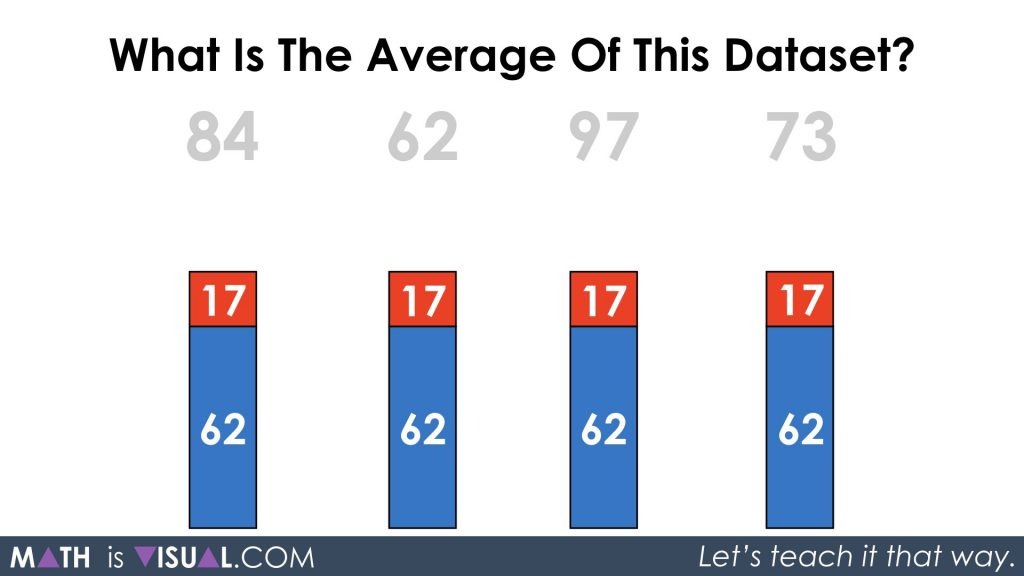
Thus, re-composing the two parts of 62 and 17 gives us a whole of 79 which is the average for our original data set of 84, 62, 97, and 73.
Again, I want to reiterate that the intention of this set of visual prompts is to ensure that students develop the necessary conceptual understanding to help them develop procedural fluency (i.e.: the understanding and development of the algorithm) so they aren’t just relying on steps that have little or no meaning.
How’d It Go?
Thanks for watching and reading!
Did you use this in your classroom or at home? How’d it go? Post in the comments!
Dive into a full problem based math unit related to mean.
Math IS Visual. Let’s teach it that way.
![Olympics [Day 2] - Purposeful Practice - MATH TALK Visual Prompt Animation](https://mathisvisual.com/wp-content/uploads/2022/01/Olympics-Day-2-Purposeful-Practice-MATH-TALK-Visual-Prompt-Animation-3-232x130.gif)
Add comment