In This Set of Visual Number Talk Prompts…
Students will explore the frequency of different categories relative to the entire data set. Students will represent their findings in a relative frequency table. They will investigate the relationship between fractions and percent.
Intentionality…
Students will engage in a visual math talk and will have an opportunity to develop a deeper understanding of the following big ideas.
- Frequency is the number of times a category or event occurs within a data set.
- A relative frequency table shows each category expressed as a fraction of the total quantity or frequency.
- Relative frequency can be represented using fractions, decimals, or percents.
- Fractions, decimals, and percents can all represent relationships to a whole.
- The sum of the relative frequencies is 1 or 100%.
String of Related Problems
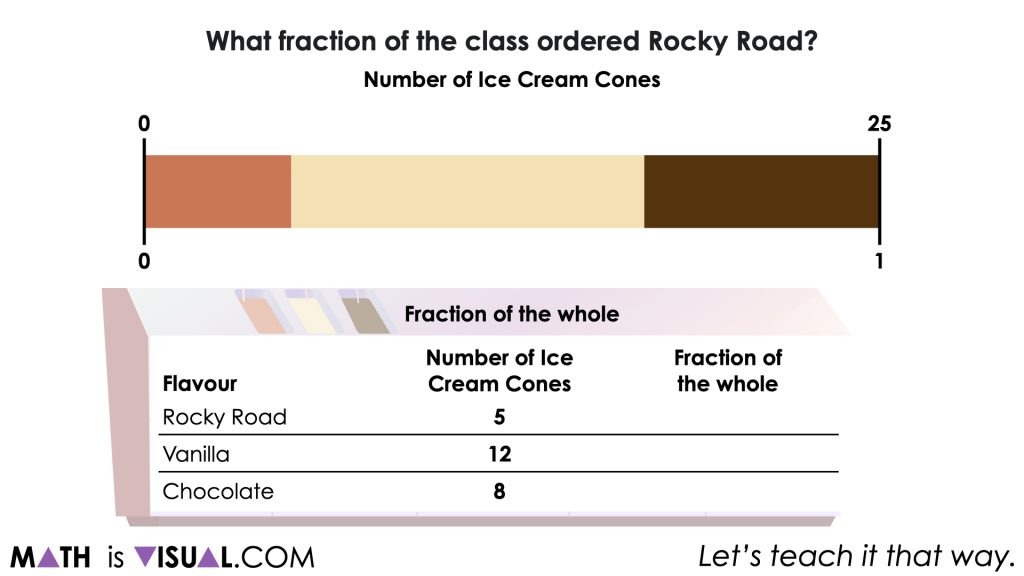
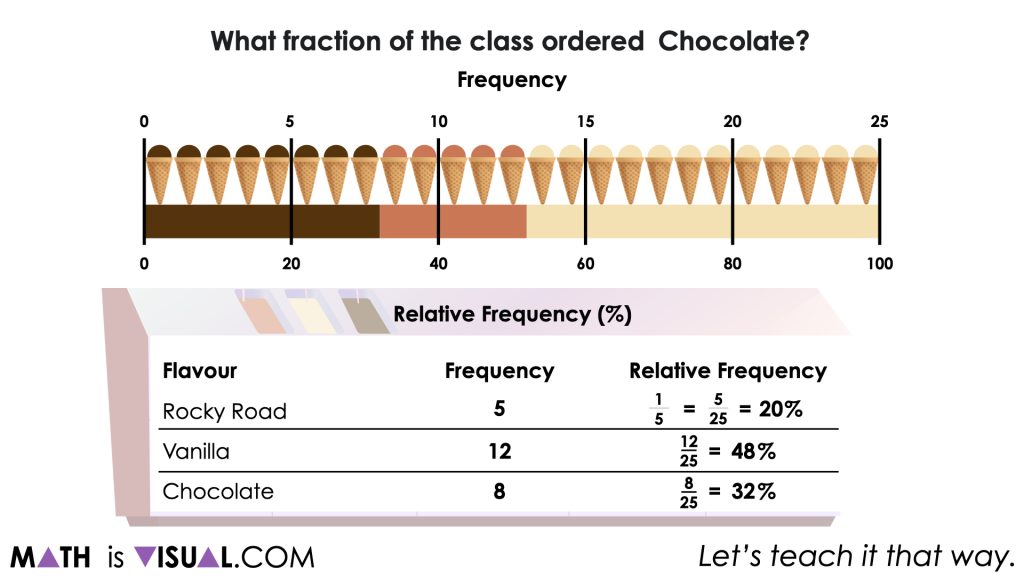
Present the following incomplete table. Work together to determine the relative frequency for each ice cream flavour. Encourage students to discuss their strategies. Students will likely scale the total frequency to 100 in order to describe the relative frequency as a percent.
Visual Number Talk Prompt
Student prompt:
A class of 25 students purchased ice cream cones.
What fraction of the class ordered chocolate?
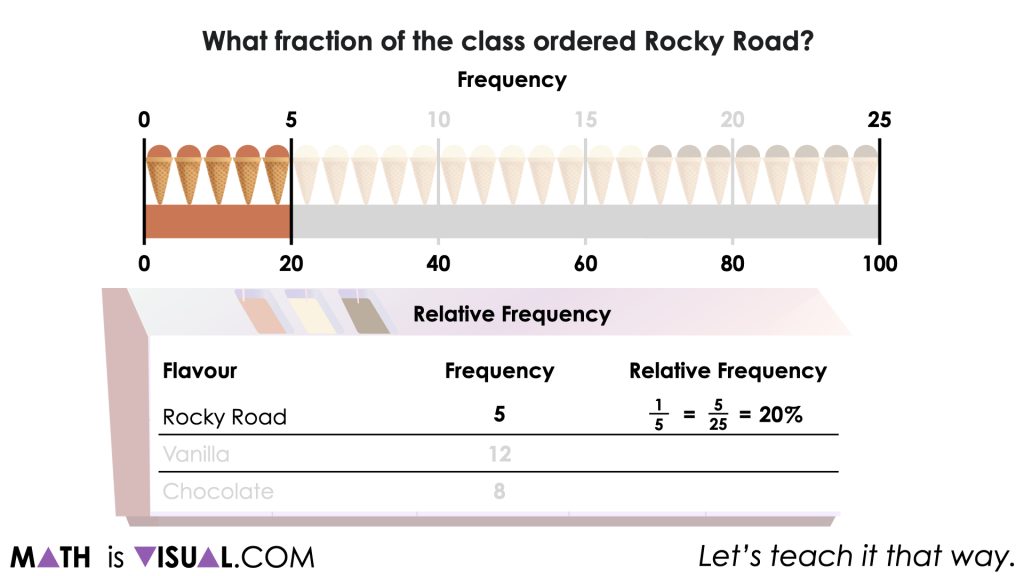
…rocky road?
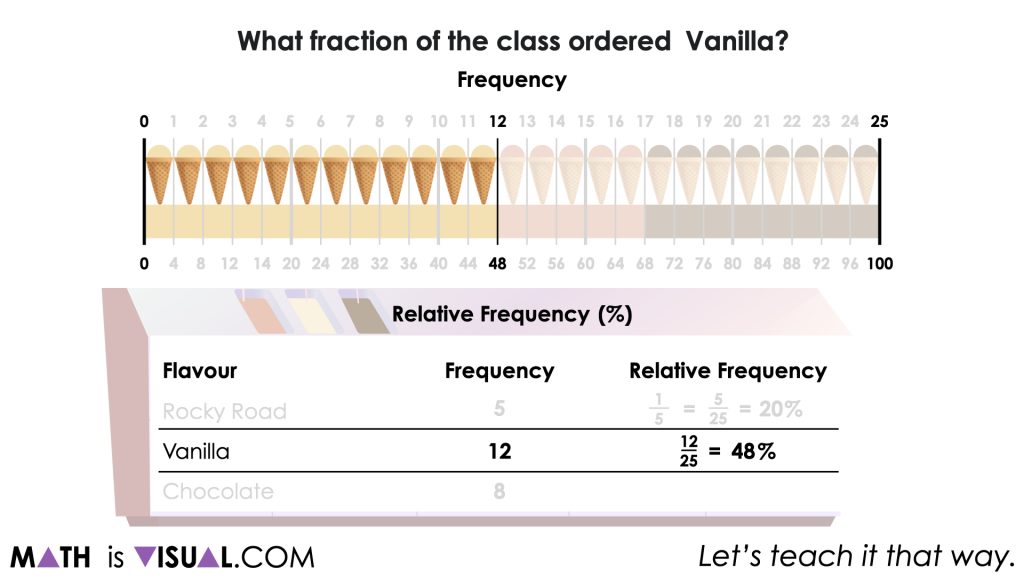
…vanilla?
Convince your neighbour.
You will notice that while we are asking students to determine the number of ice cream cones and the fraction of the whole relative to the total number of ice creams purchased, we are trying to explicitly make a connection that in data literacy, the number of ice cream cones is known as the frequency and the fraction of the whole is known as relative frequency which is often presented as a percentage.
Students can leverage a tape diagram or double number line to begin determining the fraction of the whole as well as the percentage of the whole for each flavour relative to the total.
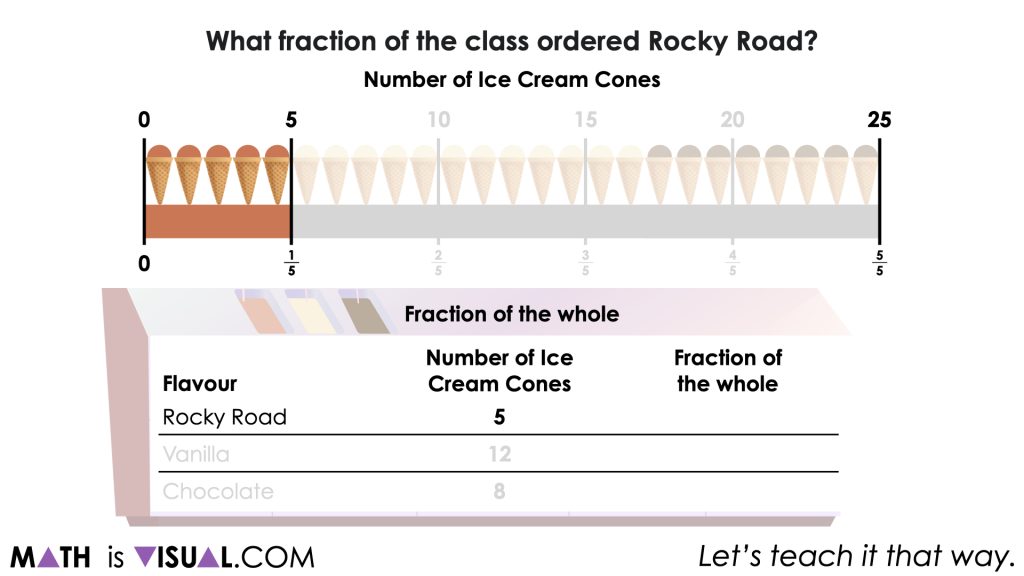
Note how easy it is for students to leverage the visual model to work between the number of ice cream cones, fractions and percentages by leveraging the ratio relationship that exists.
While students would probably more easily re-draw the double number line (one for each flavour), our visual simply shows the flavours “changing positions” in a commutative like way to represent various approaches.
Ultimately at the end of this work, we want to help students to deepen their understanding of frequency and relative frequency while also increasing their fluency and flexibility with fractions, percent and ratio relationships.
Want to Explore These Concepts & Skills Further?
One (1) additional number talk prompt are available in Day 2 of the Flavour Frenzy problem based math unit that you can dive into now.
Why not start from the beginning of this contextual 5-day unit of real world lessons from the Make Math Moments Problem Based Units page.
Did you use this in your classroom or at home? How’d it go? Post in the comments!
Math IS Visual. Let’s teach it that way.
![Planting Flowers [Day 2] - Revealing a Rate Through Partitive Division MIV Featured GIF](https://mathisvisual.com/wp-content/uploads/2021/07/Planting-Flowers-Day-2-MIV-Featured-GIF-232x130.gif)
Add comment