In This Set of Visual Number Talk Prompts…
Students will explore displayed categorical data sets with measurements in fractions of a unit and determining the difference between two data points. This visual math talk serves to develop a deeper understanding of the following big ideas.
- There are different types of data;
- Categorical data refers to a data type that can be identified based on the names or labels given to them;
- Categorical data is either nominal or ordinal;
- Bar graphs are used to compare and contrast numbers, frequencies or other measures of distinct categories of data;
- The numerical values of a data set need to be considered when a scale is chosen;
- A fraction can represent a part of a whole;
- The range is the difference between the lowest and highest values within a data set;
- The range is calculated by subtracting the lowest value from the highest value.
Students might write and/or model their responses independently.
String of Related Problems
Present the various ranges below one at a time. For each range, ask students to determine the possible heights of the shortest and tallest tree within each data set.
Model a few student suggested measurements for each range on a number line. Work with students to determine an appropriate scale for the data points that you model. Note that it does not matter which two values are selected, as long as the difference is consistent.
The range we will explore in this set of visual number talk prompts is 1 ¾ feet. You can access the full set of visual number talk prompts on the Make Math Moments 5 day unit called Evergreen.
Visual Number Talk Prompt
Students Prompt:
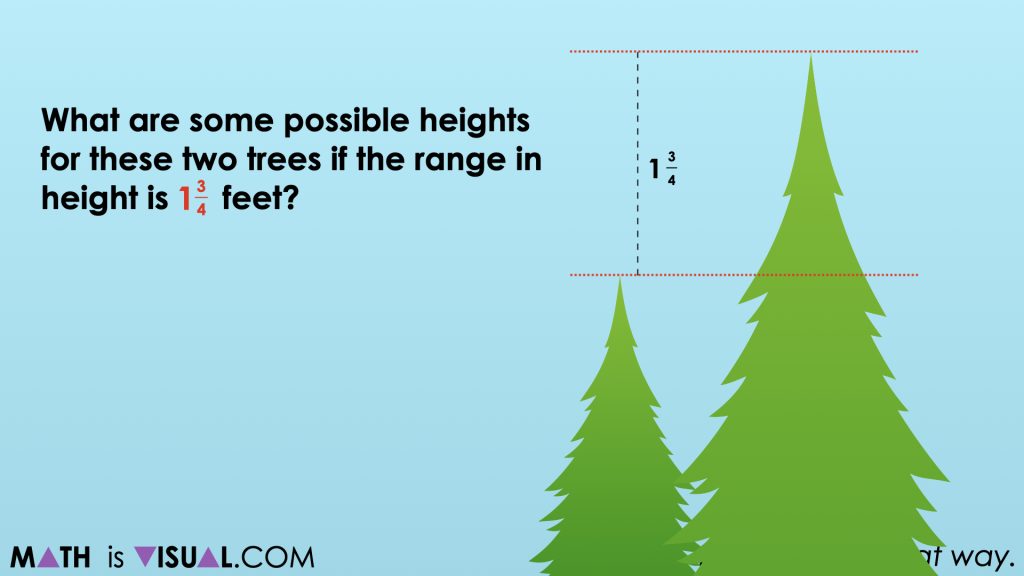
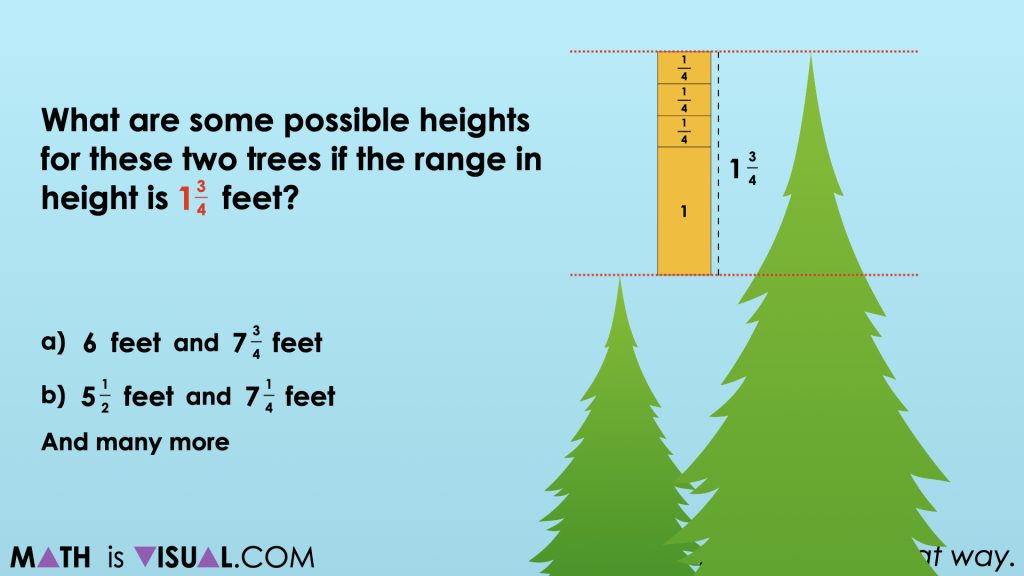
What are some possible heights for these two trees if the range in height is 1 ¾ feet?
Give students some time to work through some possibilities and share them with their neighbours.
Some obvious choices would be combinations that have a whole number of feet representing the height of the shorter tree such as 2 feet so that the taller tree would simply be 1 ¾ feet taller or 3 ¾ feet. Having students who used this strategy share first would be helpful as these would be the most accessible combinations and would be easy to model for all learners.
Ask other students to share other combinations where the shorter tree height is not a whole number of feet tall to encourage other possibilities that may prove to be more challenging to work through.
You might even ask students for a possibility where the taller tree is a whole number of feet, therefore requiring students to subtract 1 ¾ feet from that quantity.
Be sure to model the combinations that students share with you and encourage them to explain their thinking so you can attempt making their thinking visible.
In the visual math talk prompt video, you will see the combinations of 6 feet and 7 ¾ feet as well as 5 ½ feet and 7 ¼ feet modelled using a tape diagram and/or linear model.
Want to Explore These Concepts & Skills Further?
Two (2) additional number talk prompts are available in Day 5 of the Evergreen problem based math unit that you can dive into now.
Why not start from the beginning of this contextual 8-day unit of real world lessons from the Make Math Moments Problem Based Units page.
Did you use this in your classroom or at home? How’d it go? Post in the comments!
Math IS Visual. Let’s teach it that way.
![Planting Flowers [Day 2] - Revealing a Rate Through Partitive Division MIV Featured GIF](https://mathisvisual.com/wp-content/uploads/2021/07/Planting-Flowers-Day-2-MIV-Featured-GIF-232x130.gif)
Add comment