In this series of Math Is Visual Prompts, students are given the opportunity to start comparing and ordering numbers through the use of an early linear model through the use of “number paths” on their developmental trajectory towards the eventual use of the much more abstract number line.
As always, the visuals provided as a consolidation are useful AFTER students are given the opportunity to work with these ideas concretely and after consolidating in the classroom through student work.
Let’s get started…
Placing Numbers On The Number Path Spatially
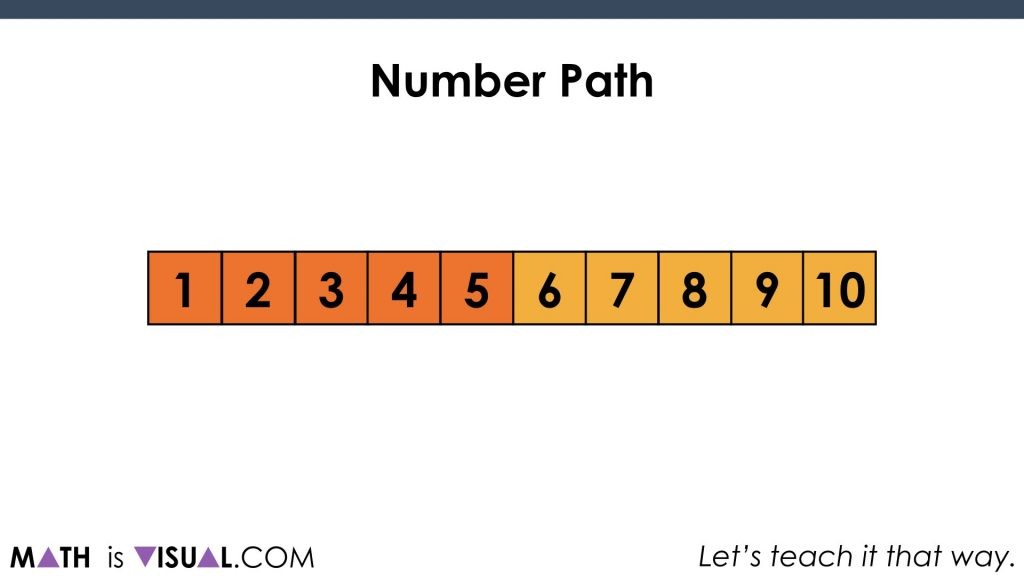
First, we must introduce the number path. There is another activity here that might be beneficial if students have not experienced a number path as of yet.
In this activity, we’ll be “covering up” the number path with a bar model to let students have the opportunity to try and spatially compare and order quantities from 1 to 10.
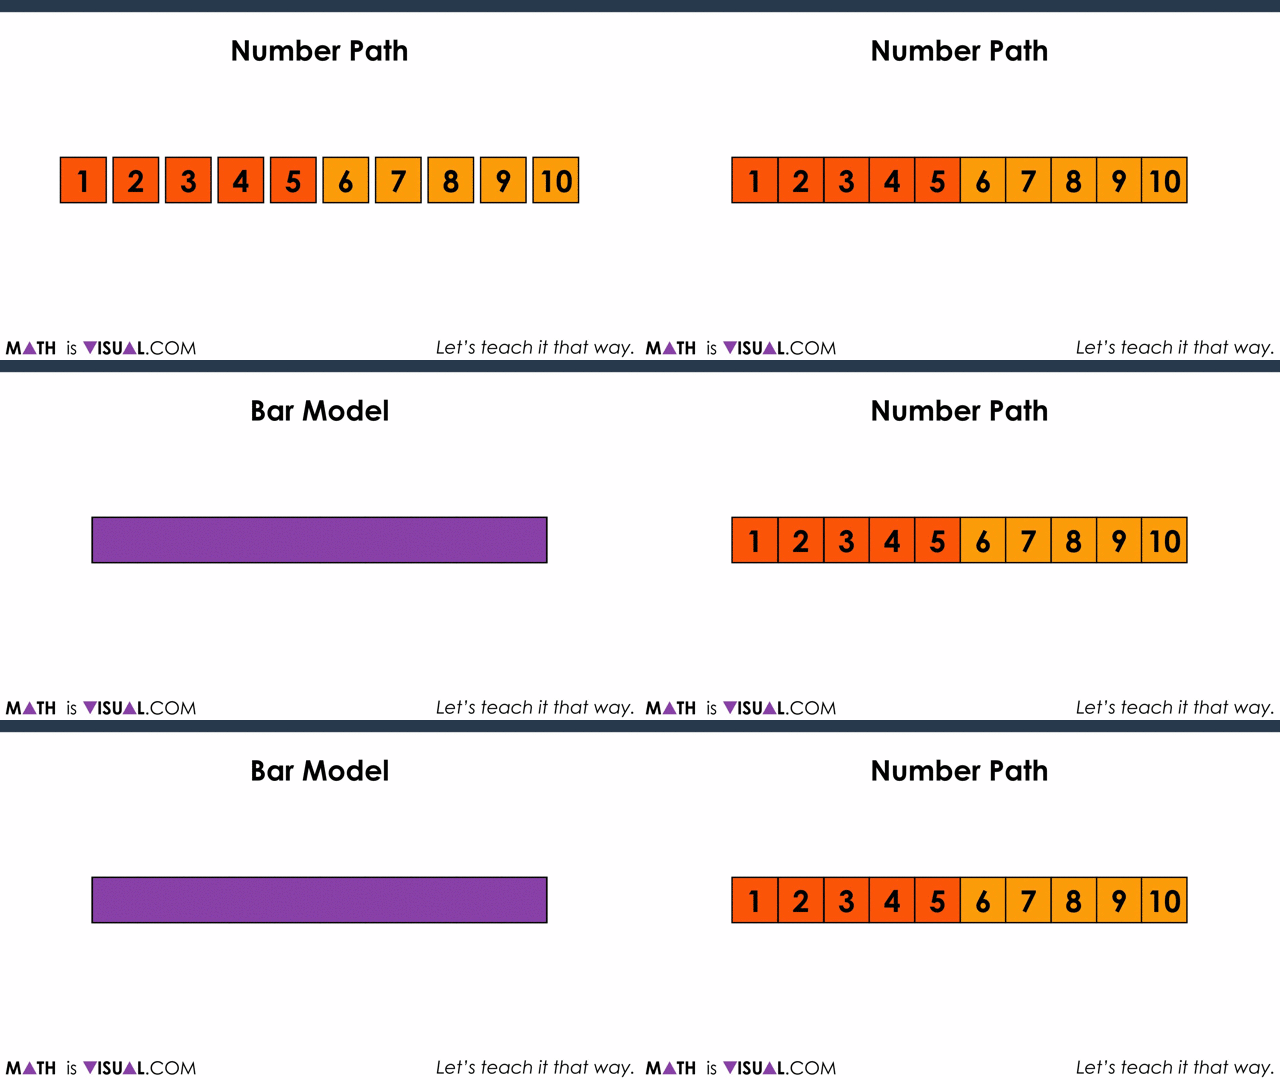
Then, it’s time to start using our spatial reasoning skills to visualize where different quantities will go on the bar model.
Challenge #1: Where Does 2 Go?
We first start with 2:
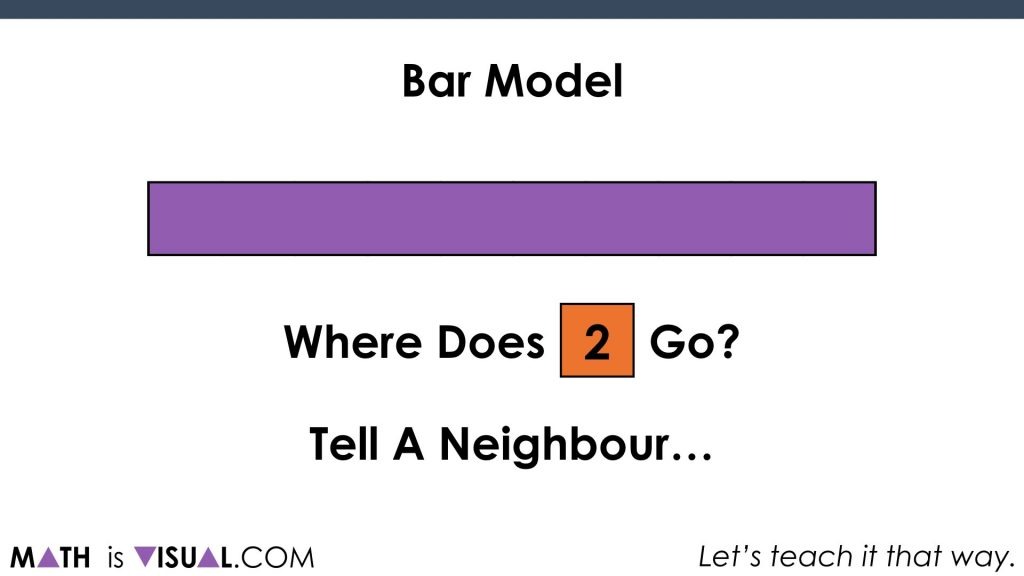
Students are instructed to “tell a neighbour”. What I’m envisioning here is giving students the opportunity to try and describe where 2 might go… to the left? …to the right? …near the middle? Where about on the bar might 2 go? Be sure to pause the animation to give students some think and share time with their neighbour(s).
Then, we give them 3 possible spots to place 2. Does it go on the green, teal, or yellow square?
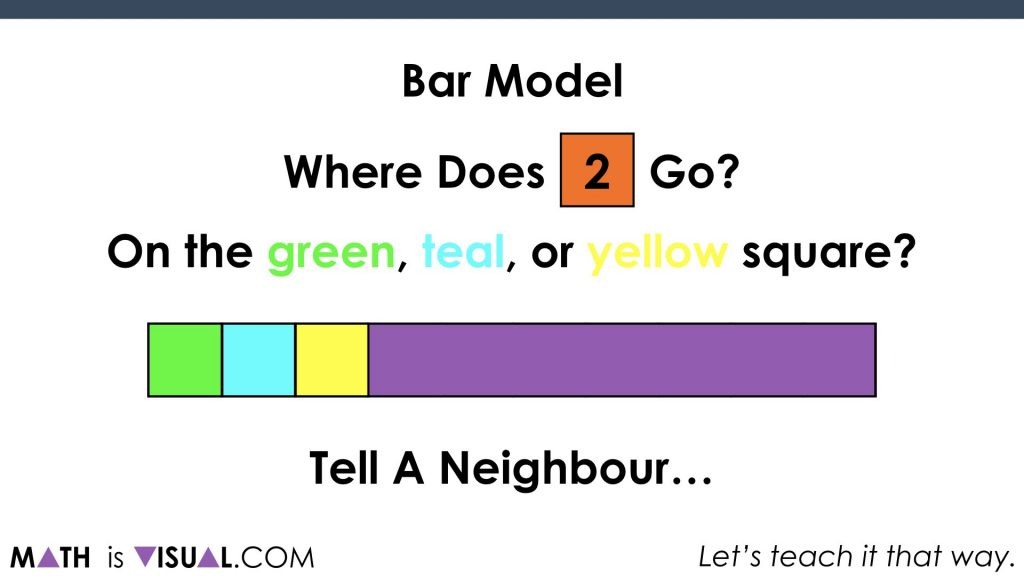
Challenge #2: Where Does 8 Go?
Then we move to the other end of the bar and ask students where 8 would go. The advantage this time is that now one of the quantities (2) is showing on the bar to promote the idea of relating 2 and 8 spatially.
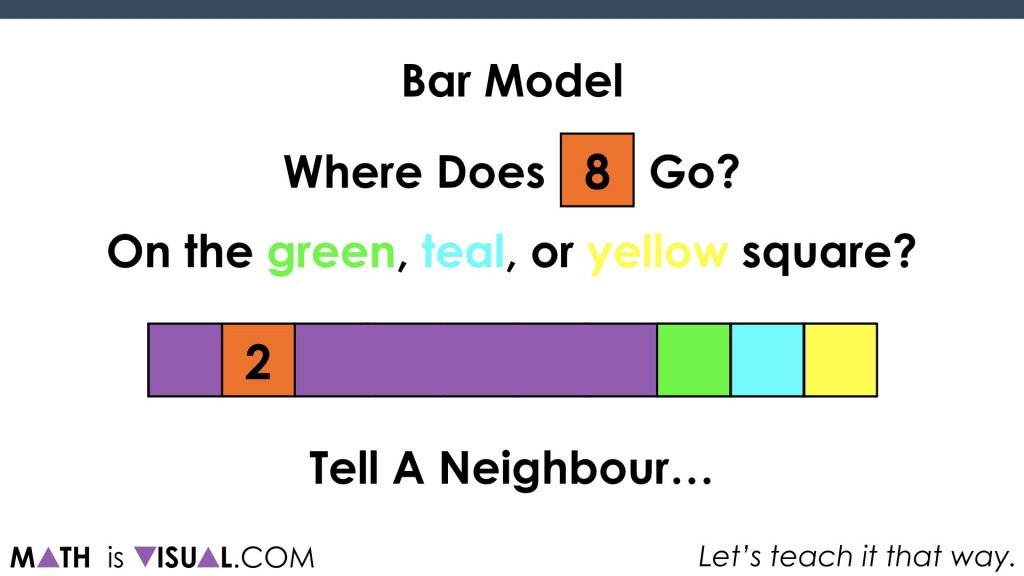
Challenge #3 & 4: Where Do We Put 4? 6?
Two more challenges that ask students where they would put 4 and then 6…
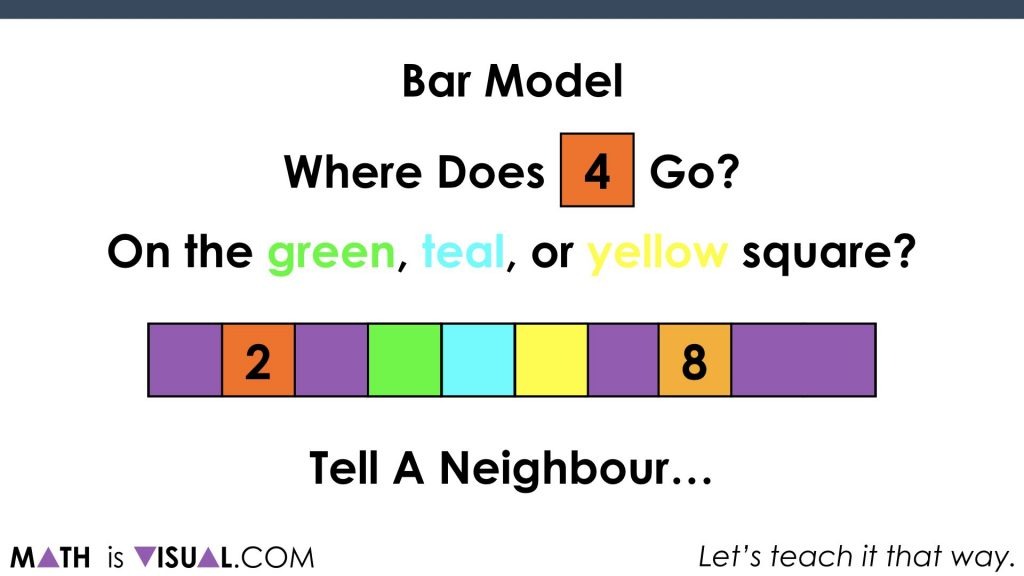
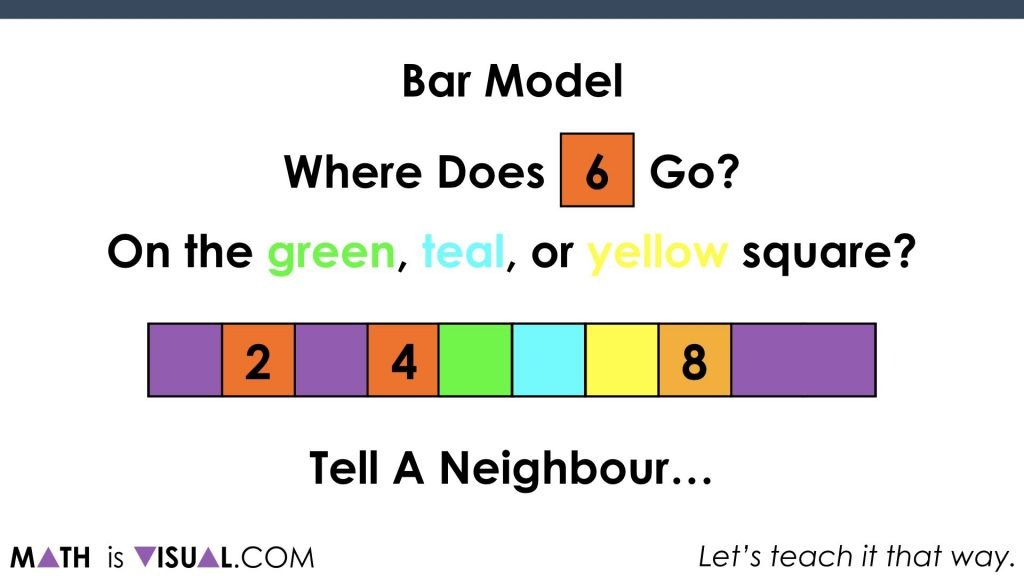
It is important for students to build an understanding of numbers relative to other numbers on the number line and this early activity will help to get them building that spatial understanding.
How’d It Go?
Thanks for watching and reading!
Did you use this in your classroom or at home? How’d it go? Post in the comments!
Math IS Visual. Let’s teach it that way.

Could we make one for benchmark fractions? Or negative integers?
My hope is to continue making visuals for many concepts. I’m just trying to find more time to carve out for them! 🙂 Thanks for the ideas!
Is there any way to have this presentation available with the text in French?
Hi Chadai!
That would be fantastic. Unfortunately, I am a 1-person team and I (sadly) do not speak French. I’d love to have someone provide French translations. If you’re interested, please email me via the contact button! Thanks!