In This Set of Math Visual Prompts…
Students will reinforce concepts related to ratios and to explore how quantities covary by finding equivalent ratios through scaling in tandem.
Intentionality…
The purpose of this set of visual number talk prompts is to consider different ways to describe relationships between quantities, including part-to-part ratios and scaling them as a composed unit.
We hope to develop a deeper understanding of the following big ideas:
- A ratio is a multiplicative comparison between two or more quantities;
- There are two types of ratios; a composed unit ratio and a multiplicative comparison ratio;
- A composed unit is often (not always) a ratio with two distinct units;
- Unknown quantities in a ratio relationship are often most efficiently revealed through multiplicative thinking strategies rather than additive thinking strategies;
- A composed unit ratio can be scaled in tandem;
- Ratios can be constructed by comparing a part to its whole (part-to-whole) or comparing a part to another part of the whole (part-to-part); and,
- Ratios can be represented using the separator “to” or a colon “:”. Two quantities from a ratio relationship can also be represented as a quotient through the use of the division symbol “÷” or with the fraction bar.
Preparing to Facilitate This Number Talk
This math talk is crafted in a way to foster discussion and the construction of viable arguments. As such, they are open ended and have more than one possible response.
Begin the visual number talk prompt video and be prepared to pause where indicated.
Prompt:
Which lemonade recipe is better?
![Keep It Up [Day 4] - Practice with Ratios and Percents - 02 - Which Recipe 01 Image001](https://mathisvisual.com/wp-content/uploads/2022/04/Keep-It-Up-Day-4-Practice-with-Ratios-and-Percents-02-Which-Recipe-01-Image001-1024x576.jpeg)
This question is deliberately open ended and may prompt some debate, depending on taste.
Some possible ideas students might share include:
- Recipe B would taste stronger, so it would be better.
- Recipe A has less sugar per cup so it’s healthier.
- Recipe A has 1 cup of sugar for 6 lemons, but recipe B has 1 cup for 4 lemons, so recipe B would be sweeter.
Of course, these are just some possible observations and many more ideas may be highlighted by your students.
Next, another prompt will be shared on the screen:
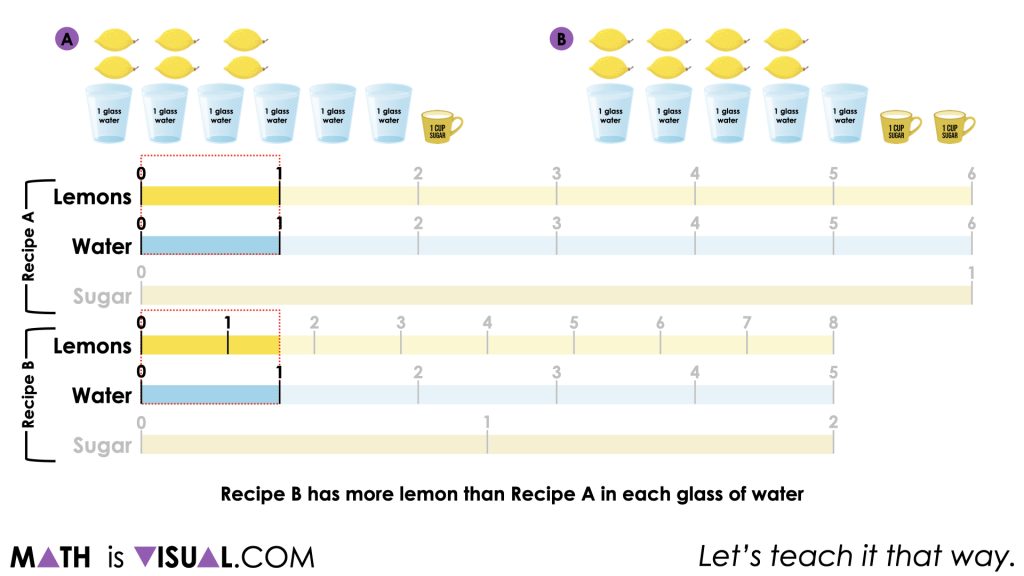
Which recipe is more “lemon-y”?
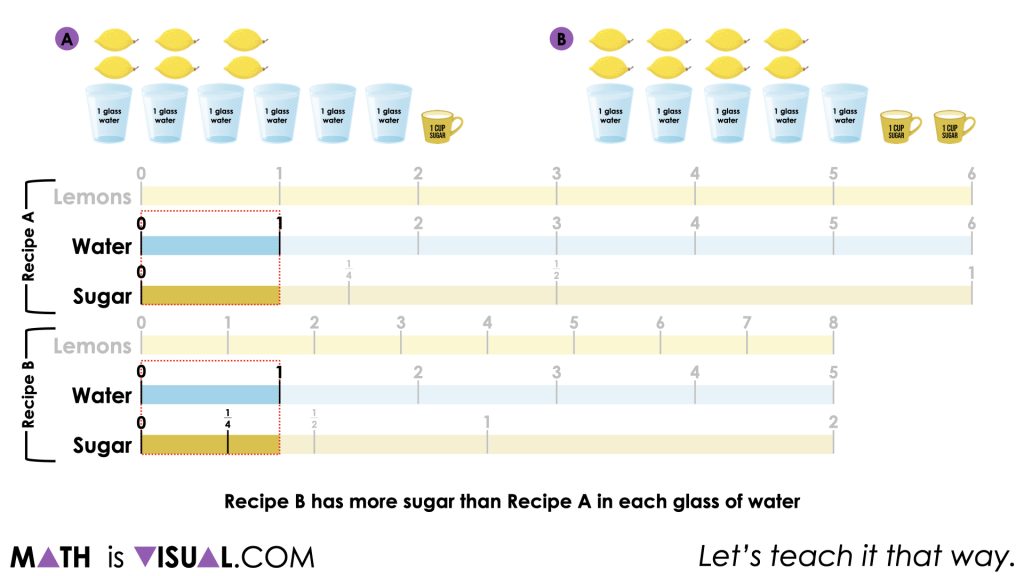
Which recipe is more “sugar-y”?
How could you convince someone you’re right?
Although there are a number of ways students can go about convincing you of which recipes are more lemon-y or more sugar-y, the use of a tape diagram or number line can be very helpful.
When comparing how lemon-y each recipe is, we can compare how many lemons there are for each part of water to determine which will have a more lemon-y taste. In this case, we can see that recipe B has more than 1 and a half lemons (8/5 lemons to be exact) for every 1 glass of water compared to 1 lemon for every 1 glass of water in recipe A.
When comparing which recipe is sweeter or more sugary, we can focus on how much sugar is in each recipe as compared to a single glass of water.
Very quickly, we can see from the original image that there were 2 cups of sugar for 5 glasses of water in recipe B whereas recipe A had a single cup of sugar in 6 glasses of water.
Looking on the tape diagram we can also see that recipe B must be more sugary as well.
Want to Explore These Concepts & Skills Further?
Eight (8) additional number talk prompts are available in Day 4 of the Keep It Up! problem based math unit that you can dive into now.
Why not start from the beginning of this contextual 5-day unit of real world lessons from the Make Math Moments Problem Based Units page?
Did you use this in your classroom or at home? How’d it go? Post in the comments!
Math IS Visual. Let’s teach it that way.
Add comment