In This Set of Visual Number Talk Prompts…
Students will extend shrinking linear patterns when given the graph of a line. They will make near and far predictions and describe the pattern in words.
Intentionality…
Students will engage in a visual math talk using graphical representations of shrinking patterns and will have an opportunity to complete independent purposeful practice. The math talk serves to develop a deeper understanding of the following big ideas:
- Patterns can be extended because they are repetitive by nature.
- Pattern rules are generalizations about a pattern, and they can be described in words.
- A pattern can be extended to make a prediction.
- For far predictions, calculations are required for efficiency.
- In a shrinking pattern, the values increase.
- In a linear pattern, the values increase/decrease at the same rate.
- Graphical representations of linear growing and shrinking patterns appear as straight lines.
String of Related Problems
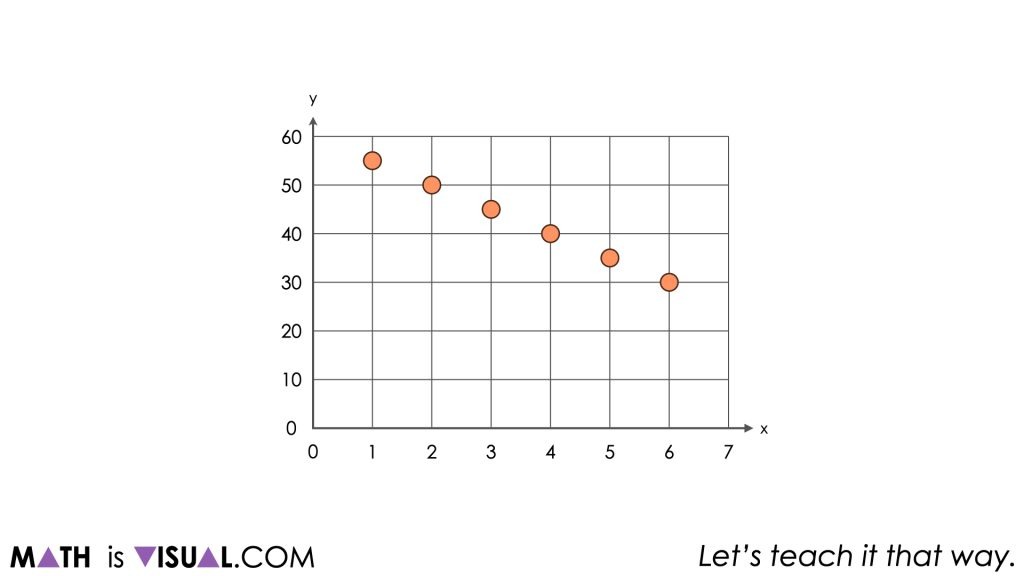
In today’s set of visual math talk prompts, students will be presented with various graphical representations of linear patterns, one at a time. Ask students to tell you what they know about the pattern and to jot down everything that they know based on what they see.
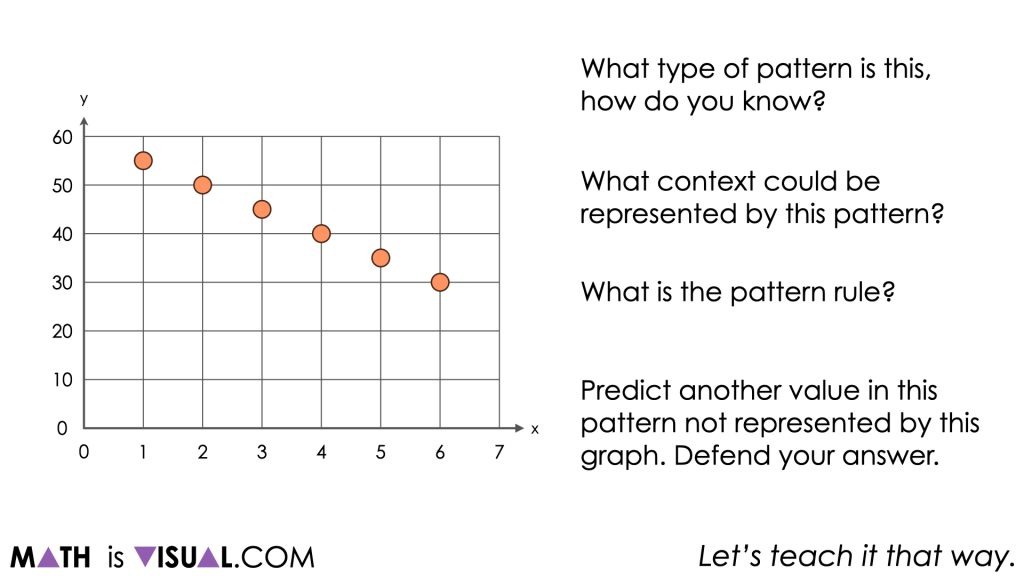
After students have an opportunity to turn and talk as well as share out to the group as a whole, students will be asked to answer the following:
- What type of pattern is this, how do you know?
- What context could be represented by this pattern?
- What is the pattern rule?
- Predict another value in this pattern not represented by this graph. Defend your answer.
Since today’s set of visual patterns (geometric patterns) are linear relationships, we will be intentionally seeking opportunities to identify and highlight the initial value (or y-intercept) and the rate of change (or slope of the line) from the given graphical representations by leveraging the equivalent ratios that reveal the rate when divided partitively. This idea is often referred to as rise over run.
Facilitator Note: After each prompt, give students an opportunity to turn and talk with a partner before asking a few students to share their thoughts with the whole-group.
Visual Number Talk Prompt
Student prompt:
What do you know about this pattern?
Jot down everything you know.
Give students an opportunity to turn and talk as well as share out to the group before presenting them with these questions:
What type of pattern is this, how do you know?
What context could be represented by this pattern?
What is the pattern rule?
Predict another value in this pattern not represented by this graph. Defend your answer.
Students may have already shared that this graph was a decreasing linear relationship previously, however it might be helpful to ensure that all students recognize this and understand why that is true.
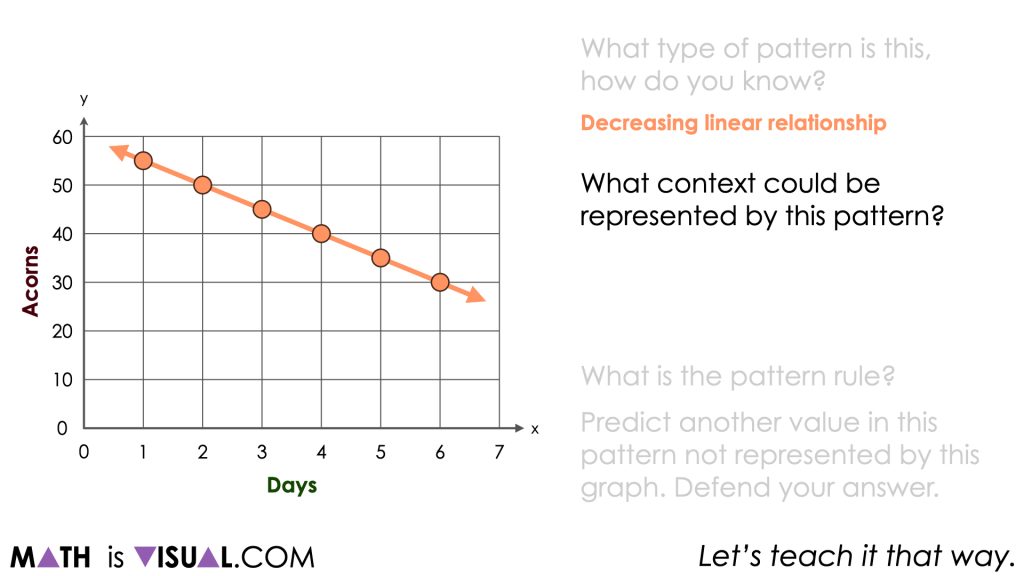
Students may have also shared different contexts that could be represented by this relationship. Be intentional about ensuring students know that many contexts could work for this relationship and the one we will share here is not the right context, but rather just one of many possibilities that could work.
When students share the pattern rule, be mindful to listen for students referencing characteristics of this particular decreasing linear relationship. Are students referencing the initial value or rate of change without necessarily realizing it? Be sure to highlight or help them emerge these ideas based on what they share from the graph.
Although some students may use the language of something like:
“It goes down by 3 every time.”
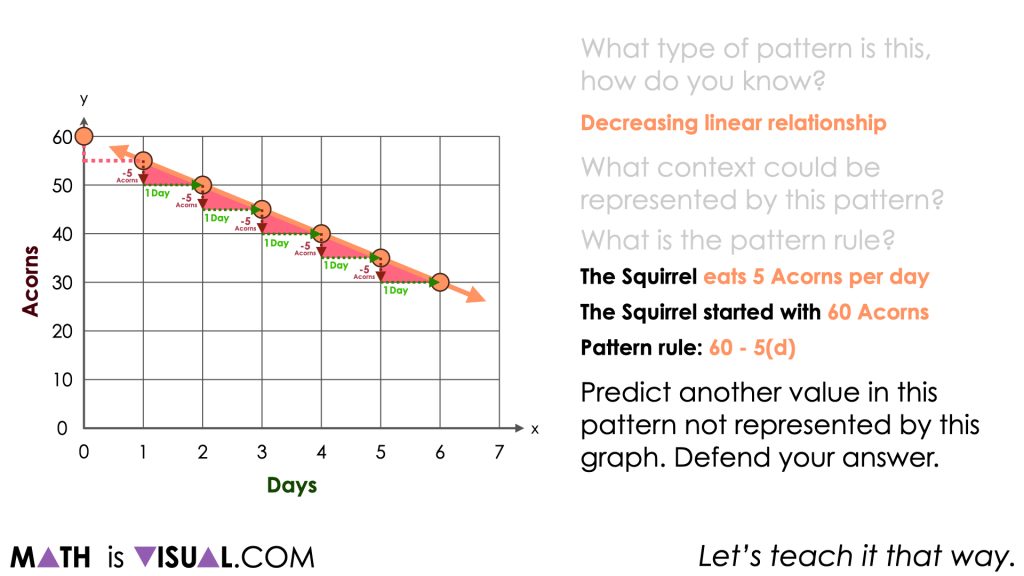
Be sure to explicitly share how we might see this relationship in the graph. For example, noting that after 4 days, the number of acorns decreased by 20 acorns is an equivalent ratio to after 2 days, the number of acorns decreased by 10 acorns.
-20 acorns to 4 days
-10 acorns to 2 days
-5 acorns to 1 day
These equivalent ratios can be used to reveal a rate through partitive division. In this case, the rate would be -5 acorns per day.
Often times, when using the equivalent ratios to help model the rate of change on a graph, mathematicians often call this strategy “rise over run” since you are using the change in the dependent variable (y) partitively divided by the change in the independent variable (x).
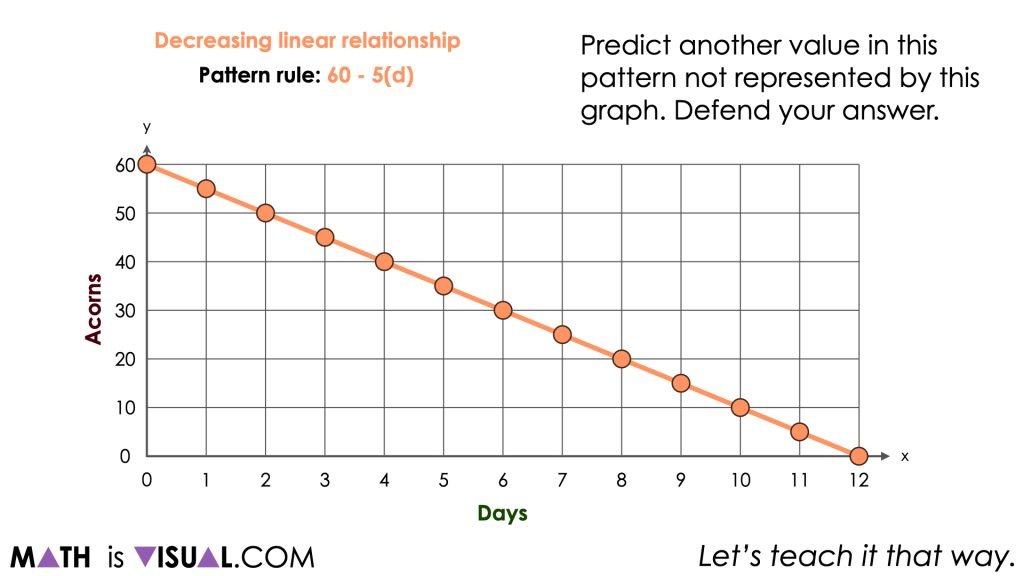
By extending the pattern backwards to day 0, we can reveal the initial value (y-intercept) and highlight a pattern rule of:
Starts with 60 acorns, removing 5 acorns each day
Or, as algebraic expressions such as:
60 – 5d
-5d + 60
-5x + 60
Or, algebraic equations such as:
N = 60 – 5d
N = -5d + 60
y = -5x + 60
Want to Explore These Concepts & Skills Further?
Two (2) additional number talk prompts are available in Day 4 of the Acorn Hoarding problem based math unit you can dive into now.
Why not start from the beginning of this contextual 5-day unit of real world lessons from the Make Math Moments Problem Based Units page.
Did you use this in your classroom or at home? How’d it go? Post in the comments!
Math IS Visual. Let’s teach it that way.

![Planting Flowers [Day 2] - Revealing a Rate Through Partitive Division MIV Featured GIF](https://mathisvisual.com/wp-content/uploads/2021/07/Planting-Flowers-Day-2-MIV-Featured-GIF-232x130.gif)
Add comment